Briefly
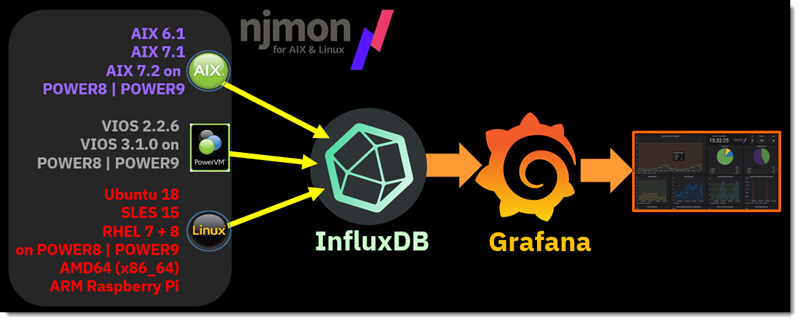
njmon is like nmon. It is a performance and configuration data collector for AIX, VIOS and Linux.
- njmon is written in the C language. It is a single file and takes a second or two to compile. Only "make" and a C compiler like GCC are required.
- It collects a lot more performance and configuration data than nmon. The output is self-documenting using name=value style.
- The output is in JSON or InfluxDB Line Protocol formats. Both are self-documenting using name=value style.
- JSON format is nicely popular for immediate uploading to various performance stats time-series databases or directly sent to the "njmond" daemon on the network for insertion into InfluxDB.
- The Python language can deal with JSON data very quickly. "njmond" is written in Python and multi-threaded.
- The InfluxDB Line Protocol can be directly inserted into InfluxDB (without using njmond).
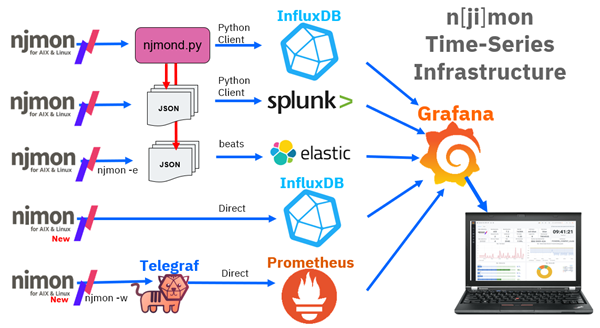
- InfluxDB is recommended, but other databases/repositories can be used to receive, store, share, and long-term manage the statistics, like Prometheus, Elastic Stack (ELK), Splunk.
- To visualise the statistics, Grafana is recommended. This takes the data from InfluxDB (and other databases) for near real-time, beautiful and powerful graphing and runs in your web browser.
- If the binary is called "njmon", it creates JSON data. If the binary is called "nimon", it creates InfluxDB Line Protocol.
- There is one version of njmon for AIX (and VIOS) and another version of njmon for any Linux on any hardware.
Supported hardware and operating systems
- njmon and nimon for AIX (and VIOS) on Power Systems
- Uses the AIX libperfstat to extract the performance stats and other UNIX system calls for things like filesystems and processes.
- Roughly: 1400 stats for AIX.
- If you are monitoring the Virtual I/O Server (VIOS), there are an additional 55 statistics. If running a VIOS Shared Storage Pool (SSP) there are an additional 35 statistics.
- njmon and nimon for Linux (many hardware platforms (POWER, Intel, AMD, ARM) and OS distributions/versions)
- The performance stats come mostly from /proc file system and UNIX-like system calls.
- Roughly: 800 stats - possible future stats include FC SAN stats.
- Spectrum Scale (GPFS), GPU statistics & Process stats recently added.
- Ideas welcome, if you know where the stats can be found on Linux.
In both cases, the njmon program runs as a small daemon on each server, virtual machine or operating system and regularly (typically, every 30 seconds) the data is sent to a central data repository for analysis and graphing.
Other njmon and nimon related tools
- ninstall - Korn shell simply installs the njmon to a suitable directory, creates a hard link to nimon, installs manual pages and sets permissions.
- njmond - written in Python. This daemon provides a central daemon repository for njmon, saving JSON data. the data can be saved to .json files or immediately forwarded on to InfluxDB, using the InfluxDB Python REST API.
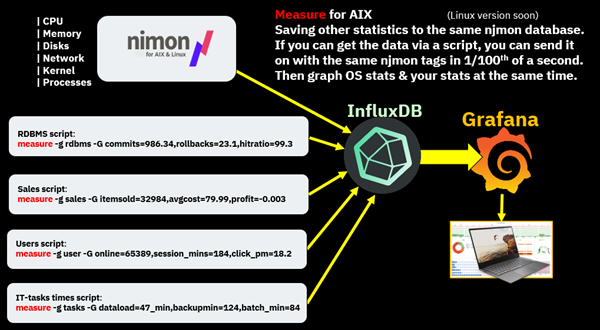
- nmeasure - written in C. This simple tool lets user add their own data for the njmon database and includes the same hostname, serial_no, MTM, HW and OS details, so it can be graphed the same way as njmon data. Typically, this would be run in a Ksh script and started regularly with cron.
- njmonchart - written in Python to convert njmon JSON data to a web page of Google chart graphs (to be viewed in a web browser) or CSV files. Similar to the older nmon and nmonchart.
- Grafana graphs - assumes you are using InfluxDB. Many sample graphs for njmon are available for download from grafana.com as a good starting point to develop your own graphs.
If you want to know more, here is: Two hours of Training on njmon via YouTube by the developer:
- Note these videos first cover njmon saving JSON via njmond collect.
- Video 9 covers nimon. nimon is recommended as it is simpler to set up. You may choose to skip video 3 if you decide to use nimon.
- The data saved into InfluxDB is the same and is graphed the same way.
- njmon + InfluxDB + Grafana Series YouTube Playlist
- Click Here Introduction njmon - 15 minutes
- Click Here Installing InfluxDB & Grafana - 11 minutes
- Click Here Install njmon and Set-up - 22 minutes
- Click Here Using njmon Graph Dashboard / Templates - 18 minutes
- Click Here 1st njmon graphs - 9 minutes
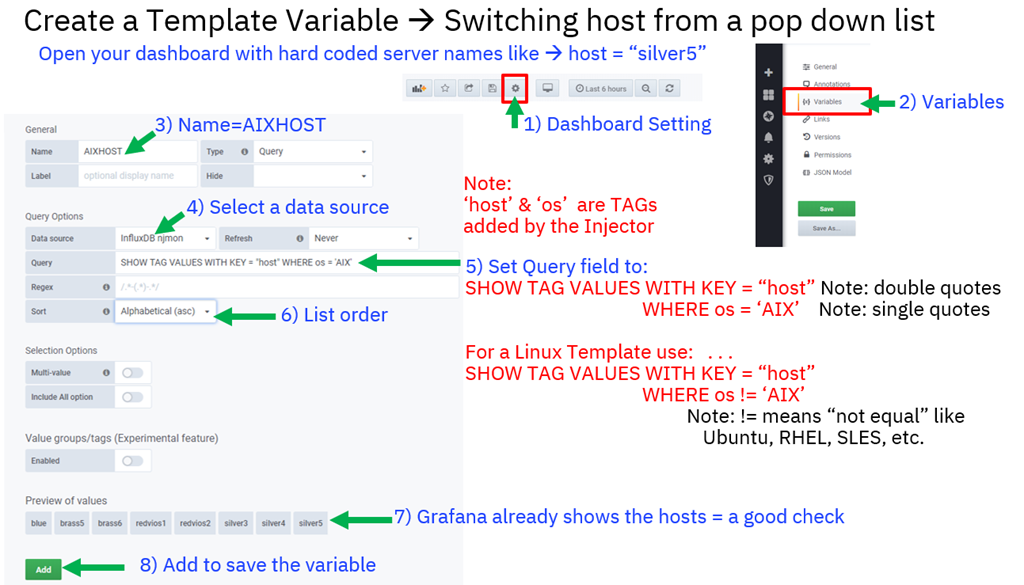
- Click Here Creating a Template to switch server - 10 minutes
- Click Here Graphing Multiple Resources - 18 minutes
- Click Here njmonchart graphs via a .html file - 9 minutes
- Click Here njmond Install & Set-up
- Click Here nimon Intro & Setup (link njmon but the data goes straight to InfluxDB (no njmond)
- Click Here Tags, Measures and Statistics
- Click Here Adding Your Own Data
- Click Here Grafana 7.1 adding your First Graphs a Demo
Let me know what is not well explained at nigelargriffiths at hotmail DOT com
Latest Downloads - December 2025 / January 2026
| Latest | AIX and VIOS | Linux on ppc64, ARM and x86_64/AMD64 | Linux on Mainframe/Z/s390 |
njmon v92, Jan 2026 version
| njmon_aix_code_binaries_v92.zip
For new features, read the njmon_aix_v92.README:
Added an experimental -~ option to start light-weight process details mode. The idea is to capture more short-running processes. This can help with User charge back calculations. The output has cutdown process stats (obviously,) but also "datetime", "tags" and "cpu_util" statistics to allow comparing system CPU time with process CPU time. Note the Linux and AIX options are different - this will be fixed next time.
AIX 7.1 (untested but very hopeful :-), AIX 7.2, AIX 7.3, VIOS 3 and VIOS 4
o This release is sponsored by:
SVA's monitoring suite called BVQ in Germany includes njmon for Linux monitoring.
| njmon_linux_code_binaries_v93.zip
Version 93 includes process I/O stats. See the README file.
njmon_linux_code_binaries_v92.zip
For new features, read the njmon_linux_v92.README:
Added an experimental -o option to start light-weight process details mode. The idea is to capture more of the short runtime processes. This can help with User charge back calculations. The output has cutdown process stats (obviously,) but also "datetime", "tags" and "cpu_total" statistics to allow comparing system CPU time with process CPU time.
AMD64: RHEL7, RHEL9, SLES15, SLES12(use SLES15), Ubuntu2404, Ubuntu 2510, CentOS7, Debian13.
Power: RHEL8, RHEL9, SLES12, SLES15.
o This release is sponsored by:
SVA's monitoring suite called BVQ in Germany includes njmon for Linux monitoring. | Use the binary version below. Or compile njmon on your mainframe using Linux code version 92 from the box on the left. |
njmon v91, Dec 2025 version
| "b" version with a bug fix for the command line arguments function
njmon_AIX_code_b_v91.zip
njmon_AIX_binaries_b_v91.zip
For new features, read the README:
1. Small changes to support VictoriaMetrics (V-M)
2. nimon -S added TimeStamps to Line Protocol to file, pipe or network socket VictoriaMetrics.
3. NJMON REST_API_PREFIX for VictoriaMetrics using proxy servers
4. Updated help output and manual pages, now also in .pdf format
5. Limiting process command line arguments now works (Oops!). set NJMON_ARGS_MAX
Power: njmon compiled on AIX 7.3 binary works on AIX 7.2 (probably for AIX 7.1)
Power: njmon compiled for VIOS3 (probably works for VIOS 4)
o This release is sponsored by:
SVA's monitoring suite called BVQ in Germany includes njmon for AIX monitoring.
| njmon_linux_v91_code.zip
njmon_linux_v91_binaries.zip
For new features, read the README:
1. Small changes to support VictoriaMetrics (V-M)
2. nimon -S added TimeStamps to Line Protocol to file, pipe or network socket (V-M).
3. NJMON REST_API_PREFIX for (V-M) using proxy servers
4. Removed use of rewind(), which new kernel have problems with /proc
5. Updated .pdf help output and manual pages
6. New process state of I = Idle kernel thread
7. Limiting process command line arguments now works (Oops!). set NJMON_ARGS_MAX
AMD64: RHEL7, RHEL8, RHEL9, SLES15, SELS12(use SLES15), Ubuntu2404, CentOS7.
Power: RHEL8, RHEL9, SELS12, SELS15.
o This release is sponsored by:
SVA's monitoring suite called BVQ in Germany includes njmon for Linux monitoring. | Use the binary version below or compile njmon on your mainframe. Use Linux version 91 from the box on the left. |
| njmon v90, Oct 2025 version | njmon_aix_v90.zip
For new features, read the README:
1. Added process command-line arguments. See option -PP
2. Process owner's group: not to be confused with the Process Group (PGRP).
3. Field hardening: if network packets are dropped, then njmon could hang. Now it will timeout & continue.
4. njmon -h and the manual pages supplied in .pdf format
5. Added rperf for Power11: S1122, S1124, E1150 and E1180.
6. njmon_VIOS3_v90 runs on AIX7.2, AIX7.3, VIOS3. Should work on AIX 7.1 & VIOS4, feedback please.
o This release is sponsored by:
SVA's monitoring suite called BVQ in Germany includes njmon for AIX monitoring. | njmon_linux_v90.zip
njmon_linux_v90_ppc64le.zip
For new features, read the README:
1. Added process command-line arguments. See option -PP
2. Process owner's group - not to be confused with the Process group (PGRP)
3. Field hardening, if network packets are dropped, then njmon could hang; now it will timeout.
4. njmon -h and the manual pages supplied in .pdf format.
5. lscpu stats: some strings changed to numbers:cpus_num, model_num, bogomips_num, sockets_num, ... Not all on every HW.
6. Currently, no access to RHEL9 on ppc64le, so no binary.
o This release is sponsored by:
SVA's monitoring suite called BVQ in Germany includes njmon for Linux monitoring. | Use the binary version below or compile njmon on your mainframe. Use Linux version 90 from the box on the left. |
| njmon v86, Feb 2025 version | njmon_aix_v86.zip
Features:
1. Fixed bug of not closing each socket() created when the remote InfluxDB or telegraf is offline.This can eventually cause a “too many files open” error.
2. Makefile reworked, work out for itself the AIX release & today’s date.
3. ninstall only installs the single binary for: AIX 7.1, AIX 7.2, AIX 7.3 and VIOS3 (should work for VIOS4)
Now called njmon_AIX7_v86
o AIX 6 & VIOS2 should still work, but you are on your own.
o This release is sponsored by:
SVA's monitoring suite called BVQ in Germany includes njmon for AIX monitoring. | njmon_linux_v84.zip
Features:
1. Fixed bug of not closing each socket() created when the remote InfluxDB or telegraf is offline.This can eventually cause a “too many files open” error.
2. User reported a limitation of a maximum of 256 logical CPUs.
- First case is a 96-core AMD server with 4 threads each. Total = 385 logical CPUs.
- Temporary fix which changes the sanity check from 256 to 2048.
3. njmon for Linux: small security fix - all popen() functions now using full command name to stop $PATH use.
o This release is sponsored by:
SVA's monitoring suite called BVQ in Germany includes njmon for Linux monitoring. | njmon_linux_mainframe_v86.zip
Update 19 Jan 2025 includes s390 (also known as Z or LinuxONE) RHEL9.3, SLES15.4 & Ubuntu22.04
Same feature as the Linux x86_64 version + the following extras:
Fixed up mainframe Serial Number, MTM and new hypervisor "z/VM 7.3.0"
Includes small sample files .json & .influxlp
Notes: v85 includes main-lining s390 config stats (no more -D MAINFRAME compile option)
and v86 fixes issue: when VM fails, provide a full hostname
Thanks to the LinuxONE Community Cloud
Sign up, request a VM, wait for OK, then create VM (5 mins), ssh & sftp access. See their Website.
Free access to a 2 CPU VM, 4GB RAM and 50 GB disk. |
| njmond v81 | njmond - if you can install the InfluxDB client Python module on AIX then the Linux version probably works. | njmond = njmon Central data collection point Service daemon written in Python.
It requires the InfluxDB client Python module.
It includes Python scripts to work with JSON formatting. Plus njmon2influx.py and nimon2influxturbo.py
njmond_v81.zip | - |
nmeasure v80
for InfluxDB 2.x | Add you own stats nmeasure_aix_v80_influxdb2.zip | Add you own stats nmeasure_linux_v80_influxdb2.zip | Not Available |
nmeasure v70
for InfluxDB 1.x | Add you own stats nmeasure_aix_v70.zip | Add you own stats nmeasure__linux_v70.zip | Add your own stat nmeasure_linux_s390_v70.zip |
| Grafana Dashboards | 1) Go to grafana.com/dashboards
then Search for njmon, browse, & view sample graphs
or
2) Import directly into your Grafana
Click the left side menu "+" then Import
add the Dashboard ID & click Load
10891 = Very simple six graphs
13701 = above plus config
15043 = above plus njmon monitoring itself
14509 = large numbers of graphs of many types
11445 = AIX process monitoring
16278 = examples of njmon v80 new stats
11899 = experimental new Grafana graphs
10832 = Monitoring a whole server
10895 = lots of config values
12573 = Carpet heat map
13703 = NFS stats
| 1) Go to grafana.com/dashboards
then Search for njmon, browse, & view sample graphs
or
2) Import directly into your Grafana
Click the left side menu "+" then Import
add the Dashboard IDs & Load
10844 = Very simple six graphs plus config
15086 = Linux process monitoring
Sorry it seems to have lost the Linux Large Dashboard
Anyone got Linux dashboards they can share? | See Linux Dashboards |
| Listing the measures and stats | nimon measure and stats | see AIX column | - |
- Older experimental Python3 injector using Splunk HTTP Event Collector (HEC) for JSON data njmon_splunk_injector_v70.py
- Alternative 1 if using nimon -> telegraf with Splunk plugin -> Splunk
- Alternative 2 if using njmon -> central njmond, saving JSON files, and Splunk collects the JSON files like it does for log files.
- njmon_tools_v56.zip
- njmon JSON output files are formatted with all the stats from data capture in a single long line of text.
- Python script to convert njmon JSON to a pretty readable format for humans - line2pretty.p: $ line2pretty <nmon_output.json > readable.json
- Plus the pretty2line.py to convert it the other way.
- Please ignore the other contents of this .Zip
Current development plans
- COMPLETED: full hostnames () tags for users with multiple virtual machines with the same short hostname
- COMPLETED: Multiple thread monitoring for njmond.py
- nimon to use Secure Sockets to InfluxDB
- Further testing of VIOS Virtual resource
- COMPLETED Test Grafana working Alert thresholds and sending emails
- Move to InfluxDB Version 2.<latest> and create new Videos on the setup.
njmonchart
Recent Release Notes
New Version 81 Linux Release - 11th April 2023
- njmon for Linux gets the tag functions like the AIX version below i.e. a catch-up for Linux.
- New User defined additional tags for InfluxDB GroupBy variables and host searches.
- Option example: -q loc=London,owner=NG,App=OracleRDBMS
- New measure called "tags" with the original tags and user-defined ones to allow these in Grafana Single-Stat panels.
- Also makes showing hostname, os, mtm, architecture, serial_no simpler to find.
- Changed Serial_no, MTM, and Architecture to dynamically updated after LPM changes.
- Fixed njmon_mode so it outputs njmon-JSON or nimon-InfluxDB.
New Version 81 AIX Release - 1st August 2022
- New User defined additional tags for InfluxDB GroupBy variables and host searches.
- Option example: -q loc=London,owner=NG,App=OracleRDBMS
- New measure called "tags" with the original tags and user-defined ones to allow these in Grafana Single-Stat panels.
- Also makes showing hostname, os, mtm, architecture, serial_no simpler simple to find.
- Added rPerf calculation for new Power10 models for Scale-out like S1024 or S1022 and E1050.
- Changed Serial_no, MTM, and Architecture to dynamically updated after LPM changes.
- Changes lsattr handling for older AIX versions without current output options.
- Fixed njmon_mode so it outputs njmon-JSON or nimon-InfluxDB.
New Version 80 Linux Released - 23 May 2022
- Changes
- InfluxDB 2+ ready. Options: -x bucket -O organisation -T token
- New stats for Load Averages from /proc/loadavg. Measure: loadavg stats: min1, mn5 min15, runable, schedulable, last_started_pid
- New stats for Swaps - swapping files stats from /proc/swaps. Measure swaps stats: filename, type, size, used, priority
- New memory rates in events per second for /proc/vmstat for incrementing counters (all 39 of them number per second). Too many to name here. All end with _rate
- Include manual pages and program help info: njmon -h or nimon -h
- Better defaults for nimon = InfluxDB database name defaults to njmon and InfluxDB port to 8086 - so no need to specify these
- Added local IP Address
- Added -A hostname for manual setting of the endpoint hostname for people with duplicate hostnames
- Debug output directed to stderr
- -H nimon save full hostname (FQDN)
- njmond.py v80 = central service to save JSON files or inject into InfluxDB. Fixes a problem in version 55 due to removing the old secret password system.
- Changes for disks
- Current measure "disks" works as before.
- Added to disk stats: discards and discards merge, busy, sectors, flushes, time - useful if using thin provisioning.
- Using the command lsblk to strip out the other junk (like disk partitions, paths and mapper) in /proc/diskstats
- -D Every line in /proc/diskstats now in new measure "diskstats"
- -M measure "filesystems" will use mount point names (like /, tmp, /home ...). This is like AIX output.
- The default uses file system devices, which is different to AIX.
- -B adds btrfs stats. btrfs = better file system (good for SAP HANA)
- Added disk add/remove automatically handled - NEEDS MORE FIELD TESTING
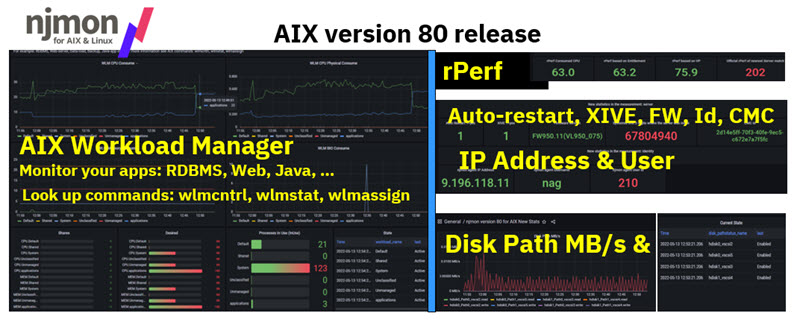
New Version 80 AIX FINAL Release - 13 May 2022
- Full AIX Workload Manager = groups processes together into classes for monitoring and control via shares
- See Redbookhttps://www.redbooks.ibm.com/redbooks/pdfs/sg245977.pdf
- Reminder AIX WLM commands are: wlmcntrl, wlmstat, wlmassign
- Added Disk Path stats and Disk Path status' - good checks for RAS and before VIOS updates
- New "-A hostname" for the user to set the njmon hostname - useful for people using duplicate hostnames!
- Five new stats for AIX & VIOS inside Measure: server = requested by nimon users
- autorestart="true" Will the virtual machine reboot on a failure or server power-on
- systemid="067804930" First 2 numbers = the IBM manufacturing site 06=Mexico
- fwversion="FW950.11(VL950_075)" Firmware version of the server itself
- ex_intr_virt="true" Using External Interrupt Virtualisation Engine (XIVE) - New in AIX 7.2 TL4 on POWER9 or higher
- partition_uuid="6be25438-3ae3-449e-8725-900d7ac4492e" Unique ID used by Cloud Management Console (CMC)
- Added local njmon agent IP Address
- Added disk add/remove automatically handled. Works for my limited systems, but needs more field testing
- AIX updated for Power10 rperf ratings
- See Grafana graphs examples here https://grafana.com/grafana/dashboards/16278
- WARNING: New InfluxDB 2+ option appears to work but still very new
WARNING: Use of InfluxDB 2+ is still in Beta Testing
- It appears to be working for InfluxDB, but not the Grafana Graphs
- I still need to document the new/strange Influx system admin commands.
- If you know InfluxDB version 2, go ahead, but I may not help much if you get stuck.
- To Do Check Grafana Dashboards work with InfluxDB 2.1 - I suspect a V1 compatibility package needs to be added.
- To Do More detail on using InfluxDB 2.1 - it has been a struggle learning the new CLI and GUI.
- COMPLETED nmeasure AIX & Linux support for InfluxDB 2.1 - nmeasure lets you directly add your own stats to the InfluxDB njmon bucket
- COMPLETED njmond.py for InfluxDB 2.1 for centrally handing JSON format from njmon. Note: changed .conf options.** Remove the previous version 80 beta 1 code and binaries
- Hints below:
- InfluDB 2+ is, of course, for the nimon command only.
- InfluxDB 2.0+ support, handled with two new options
- -T token from InfluxDB 2.1 GUI (Mandatory and switch to InfluxDB 2 API mode). Security Token is 50 characters (mega password).
- -O org InfluxDB 2 organises users, dashboards and buckets with organisation (example company or dept). If not set, "default" is used
- Note: InfluxDB 2 "databases" are now called "buckets" for each organisation
- Browse assuming a browser on the local InfluxDB 2 VM: https://localhost:/8086 - first time you create a user + passwd, org, bucket.
- Find your security token "LoadData" -> API Token
- To use the CLI, you MUST create a config with YOUR name, URL, ORG and TOKEN and activate the config file.
- influx create --config-name nigel.conf --host-url http://localhost:8086 --org default --token <100-character-password> --active
- Hints on creating an "org" and token on InfluxDB 2.1 using the "influx" command CLI (assumes you have InfluxDB 2.1 set up):
- $ influx org list
- $ influx auth list
- Example nimon with Influxdb 2.1: nimon -s30 -c 2880 -i influxIP -p 8086 -x njmon -O IBM -T <large-hexadecimal-key>
Release Notes for njmon Older Releases
Once you have a InfluxDB & Grafana: Try nextract_plus for more data
- This extracts Power Systems detail on Server, VIOS and LPAR levels from the HMC
- See this article for details and downloading the Python3 code: Click Here
- See the following YouTube video Series: Click Here
- nextract_plus: Output Grafana Graphs - actually many more graphs available now
- nextract_plus: Data Handling and Statistics
- nextract_plus: Install and Setup
What you will need to perform:
- Assuming you will use InfluxDB for your time-series database and Grafana for creating your graph dashboards.
- Other software is available like Elastic (use filebeats to monitor the .json files) and Splunk (not covered here).
- Install InfluxDB and create a njmon database (one command).
- InfluxDB & Grafana are supported on AMD64 (x86_64) or Linux on POWER8 or POWER9 and other platforms.
- Install Grafana on the same machine or VM and connect it to InfluxDB (very simple).
- Install the small program njmon or nimon on each of your endpoint operating systems
- i.e. AIX, VIOS or Linux (on any hardware).
- Two options:
- Use central daemon njmond.py
- Install the njmond.py and set the variables for your environment: user/password, hostname, database name etc.
- Set your njmon variables to contact the njmond.py to send it the data
- Add the njmon program to crontab so it starts every day
- Use the direct to InfluxDB option called nimon
- Set your nimon variables to contact InfluxDB to send it the data
- Add the nimon program to crontab so it starts every day
- Download the Grafana njmon sample dashboards for a flying start monitoring your servers.
- Modify the Grafana dashboard or create your own to investigate your data.
Options for prototype or implementing:
- All open-source = no costs (no permission!)
- Recommend operating system for a simple life: RHEL7+ & Ubuntu18+
- Own hardware (On-Prem)
- AIX on POWER8/9 based LPAR
- Linux on POWER8/9 (ppc64le) based LPAR
- Linux on AMD64 (x86_86) Server or VM
- '''Raspberry Pi 3 or 4 (Ubuntu 16)
- Your personal laptop/workstation
- Linux = very possible and tested RHEL 7.7
- Windows 10 (works but ugh!)
- Apple Mac - no idea
- But when you power off or disconnect your laptop. you can't capture njmon stats
- Cloud-Based
- Corylsis.com Works, very space limited - reduce snapshots to 15 minutes
- Influxdata.com Cloud 2.0 free option = limited rate & volume or from $150/month
- Grafana.com Cloud $50/month or you could use a laptop
- Rent a Cloud Virtual Machine (POWER or AMD64), see "own hardware"
|
Why njmon?
Infrastructure Choices
BVQ from SVA also ingests njmon JSON data. Also worth a mention: SVA supports njmon with access to hardware and has provided extensive testing and stats accuracy checking. This is greatly appreciated.
If you want to know more or give BVQ a free trial: https://bvq-software.de/de/bvq-trial
njmon AIX v80 new statistics and graphs
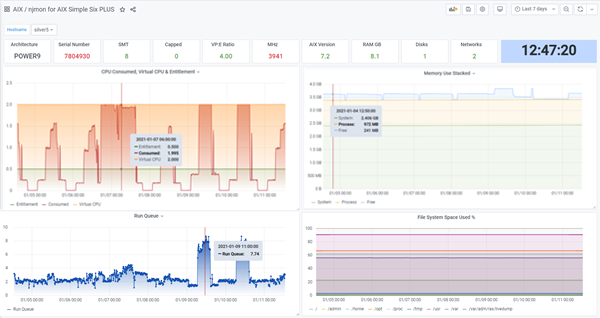
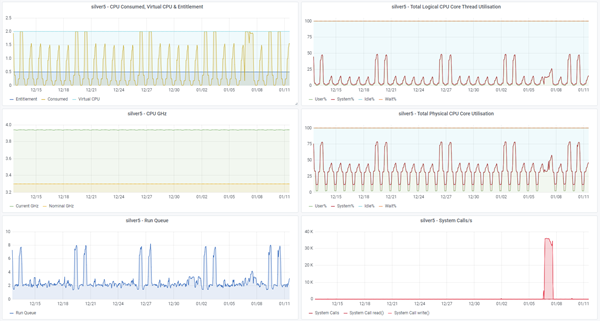
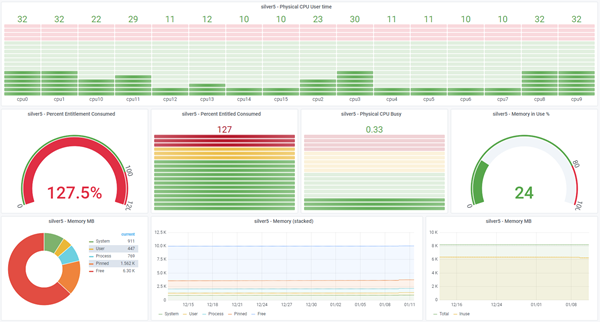
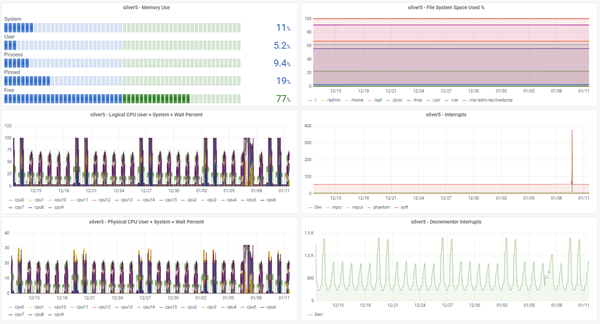
Example: Simple Six Plus Dashboard of Graphs
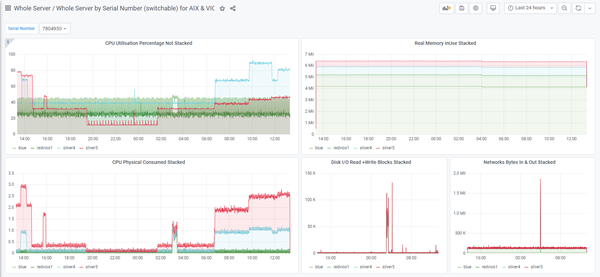
Yet more of a whole POWER server and its VMs
More Graphs of the Large Dashboard for AIX
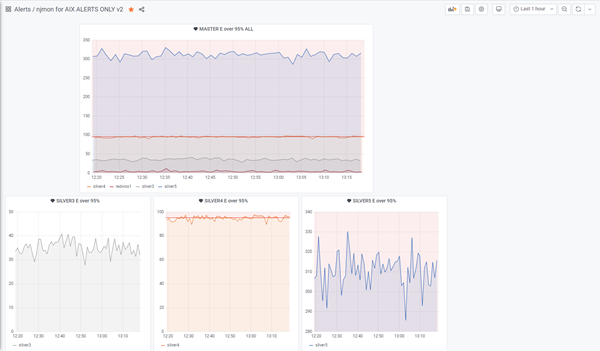
Alert Thresholds - to send you email messages about any problems
|
|
InfluxDB and Grafana are used as my primary tools for storing & graphing njmon data:
- Open source, popular, focused on time-series stats (just like njmon) and recommended to me
- Fast install and setup
- I use Ubuntu as it takes about 5 to 10 minutes to install both
- Simple Python data insertion
- See below for bulk upload and online inserting new data
- Direct access to the data for rapid, high-impact graphs and exploring the stats
Of course, any other tools that can accept JSON data can be used.
Another popular toolset is Elastic: Elasticsearch, Logstash and Kibana (ELK):
- Open source and popular for people first wanting to save and analyse/graph log file data
- From what I have read, Logstash actually stores its data as JSON format
- Use Elastic Filebeat to load your njmon JSON
- I found this surprisingly easy to set up and use
- Use filebeat to monitor a file for extra data and send that too
- As JSON is already structured, it is easy to then graph with the integrated Kibana (or Grafana!)
If you are an "elastic" expert, please share your experience and hints & tips.
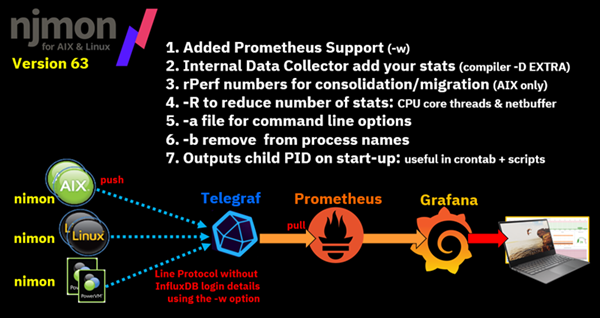
Prometheus can also be handled using the InfluxData Telegraf tool.
This also handles the difference on njmon push and Prometheus pull protocols.
|
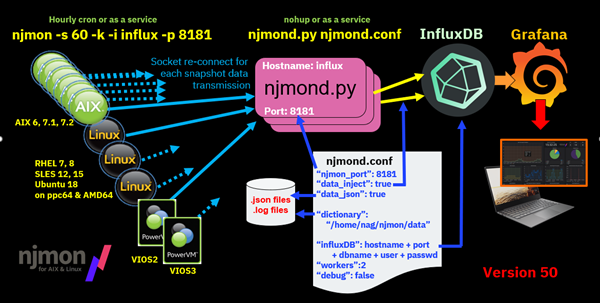
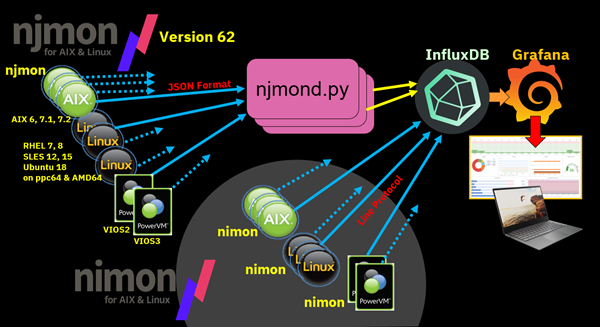
The original njmon creates JSON data, which is sent to the njmond.py central daemon for loading into InfluxDB
Later, the nimon version short-circuits the JSON, and the data goes straight to InfluxDB
Details of the sockets and commands for nimon
The nmeasure tool makes it simple to add your own data to the njmon by adding the required tags: hostname, serial number, architecture and operating system.
|
More Details
njmon endpoints I copy the njmon executable to
- AIX /usr/lbin/njmon
- Linux /user/local/bin
- njmon is proving pretty stable and does not require daily restarting
- Currently, I start njmon every hour with a -k option (no -c option), mainly for "belt and braces" safety net.
- I also have the InfluxDB server with a DNS hostname alias of "influx"
- So this works: 0 * * * * /usr/lbin/njmon -S 60 -k -i influx -p 8181
- If using a secret: 0 * * * * NJMON_SECRET=abc123 /usr/lbin/njmon -s 60 -k -i influx -p 8181
- Total one file and one crontab entry
On my central Linux InfluxDB I have:
- User "nag"
- Home directory /home/nag/njmon containing: njmond.py, njmon.conf and njmon2influx.py
- Plus the reformatting tools line2pretty.py, pretty2line.py and njmonold2line.py
- Plus a sub-directory of data - for the log file (njmon.log) and any .json files (if you are saving JSON data)
- TOTAL 6 files plus a njmon startup mechanism. I use a hands-on nohup command - in development, I am restarting often.
- You could run njmond.py as a service - hints on how to do this would be useful, please.
Notes:
- njmon endpoints now create a new socket for every packet of performance data (like a browser)
- If the back-end collector (now njmond.py) is stopped, it no longer crashes njmon
- njmon ignores the failed socket request & sends the next packet of data at the next snapshot time
- The collector & injector are merged into one Python program called njmond.py
- njmond.py has a simple config file to make life simpler; it provides InfluxDB injection
- njmond.py can also save the data to .json files. These are now one file per hostname
- njmond.py is using queues and back-end threads to do the injection - not two processes per endpoint
- Use logrotate to compress and remove older JSON data, and for the log file njmond.log
- The files get huge and the file system fills, at which point it's mayhem
- If you want to add njmon data from a file, or njmon via a pipe or njmon via SSH we use a new tool called njmon2influx
- njmon is no longer using light encryption of an initial socket connection packet
- The 1st packet data is extracted from each performance data JSON record
- The identity JSON structure includes the "secret" - called "cookie"
- Later njmon version might encrypt that to ensure the data origin & security - ideas welcome
- If security is vital, use the SSH method
- You can reject the data containing an invalid "cookie" or just set "njmon_secret": ignore
njmon modes of operation and which tools to use:
- njmon makes a local .json file (-f option), you take the files to the InfluxDB server & use njmon2influx.py to
upload the stats in batch mode
- njmon used with ssh to get the data to the InfluxDB server. Use njmon2influx.py in stream mode (batch = 1)
- If your endpoint has Python3 you can do straight to InfluxDB injection - njmon | njmon2influx.py in stream mode (batch=1)
- Previous using the Collector + Injector? Now use njmond.py with inject = true
- Previous using the Collector to centralise .json files? Now use njmond.py with json = true
- For Elasticsearch, elastic, ELK use njmond.py to get the files to a central server (see above) and then user elastic
"filebeats" to upload data
- Note there is an elastic option for njmon -e to save the JSON data in a slightly different way
- For Splunk (similar to Elastic), but I need to rework the Splunk injector for a one record per line format
- I will only do that if asked!
njmond.conf - or any file name you want
- I am hoping
{
"njmon_port": 8181,
"njmon_secret": "ignore",
"data_inject": true,
"data_json": false,
# Directory for njmond.log and any .json files
"directory": "/home/nag/njmon/data",
"influx_host": "localhost",
"influx_port": 8086,
"influx_user": "Nigel",
"influx_password": "passw0rd",
"influx_dbname": "njmon",
# The number of Python threads
"workers": 2,
"debug": false,
# next line only used by njmon2influx - Note: lines with 1st char # are ignored.
# 1 = stream each packet as it arrives
# 50 or 100 = batch record from a file to higher throughput insertion
"batch": 50
}
For Linux logrotate - I am successfully testing with /etc/logrotate.d/njmon:
Migration to v50
- If your network allows you two port numbers, then you can migrate to v50 painlessly:
- Assuming you were using the Collector + Injector and you were using port 8080, and you can set up port 8181
- Set up on your central InfluxDB a njmon directory like mine (above)
- Edit the njmond.conf for port number and set the InfluxDB username and password
- Start: nohup ./njmond.py njmond.conf &
- Then for each endpoint
- Stop njmon with ps -ef | grep njmon and kill the njmon processes
- Add the new version 50 njmon to the local bin
- Change the crontab to use port 8181
- Restart njmon with your favourite options
- Once all endpoints are done, you can stop the old collector & injector
- Remove the old code and tool files
- Set up logrotate
The njmond.log file is improved with lots of info per line and one line per snapshot arriving - so it gets big
- Here is a sample

Key:
- Time and date
- Port - 8181 should only be one, if you use one njmond.py, but you can run more than one using different ports
- Hostname
- Operating system
- Hardware
- Serial Number (tricky on Linux)
- Endpoint njmon version
|
Sample njmon graphs via InfluxDB & Grafana
Note: Click the image below for the full-size versions
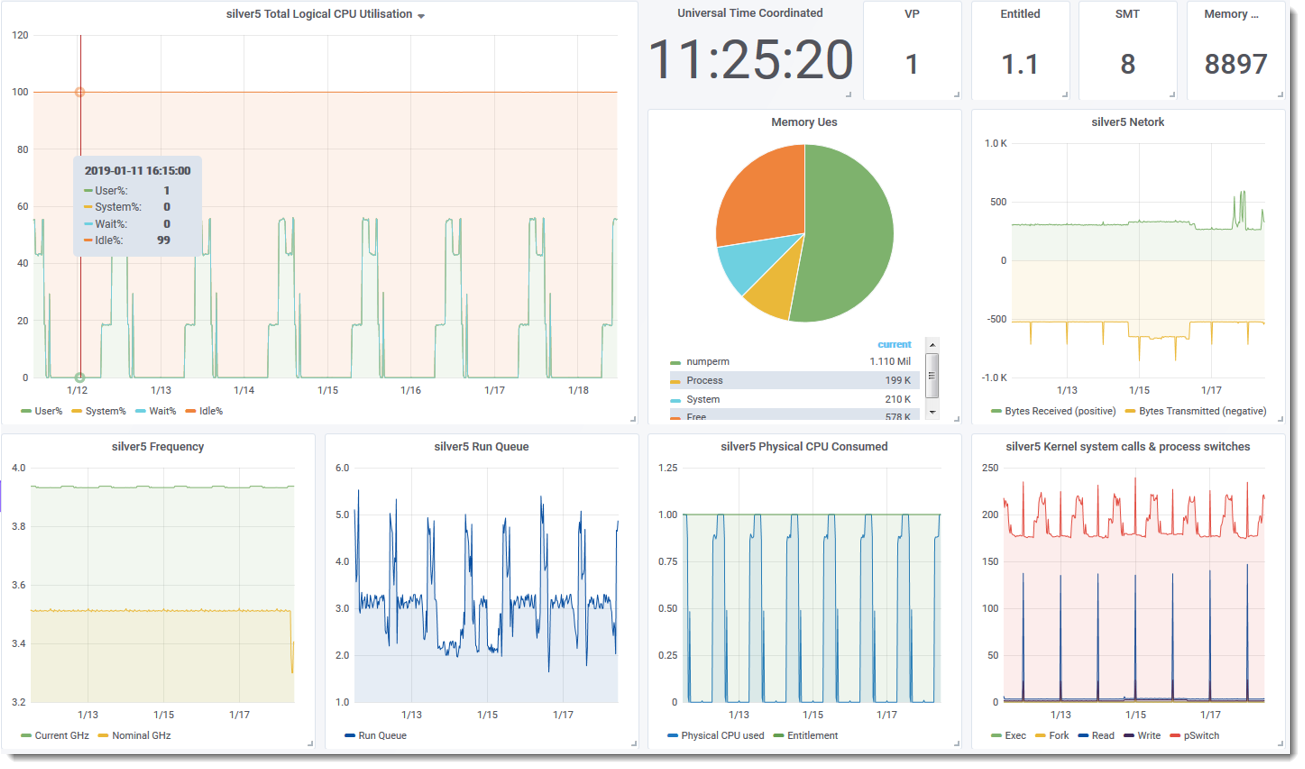
- Light-style first screens are worth
- Single stat settings of VP, Entitlement, GB Memory. Graphs: CPU Memory pie chart, Network trans/recv, CPU GHz, Run Queue, Physical CPU consumed, System calls and process switches
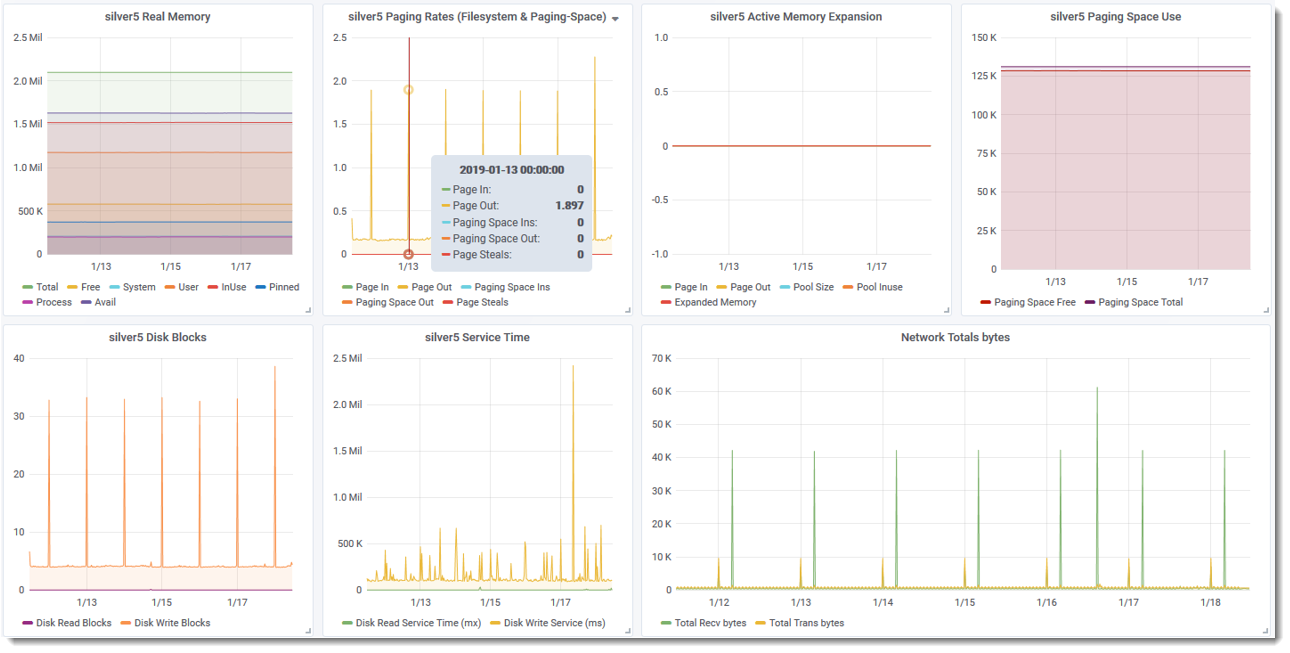
- Light style second screen
- Graphs: memory details, paging, AIX Active Memory Expansion (currently switched off), Paging space disk use, Dieck read/write, Disk Service Times, Network
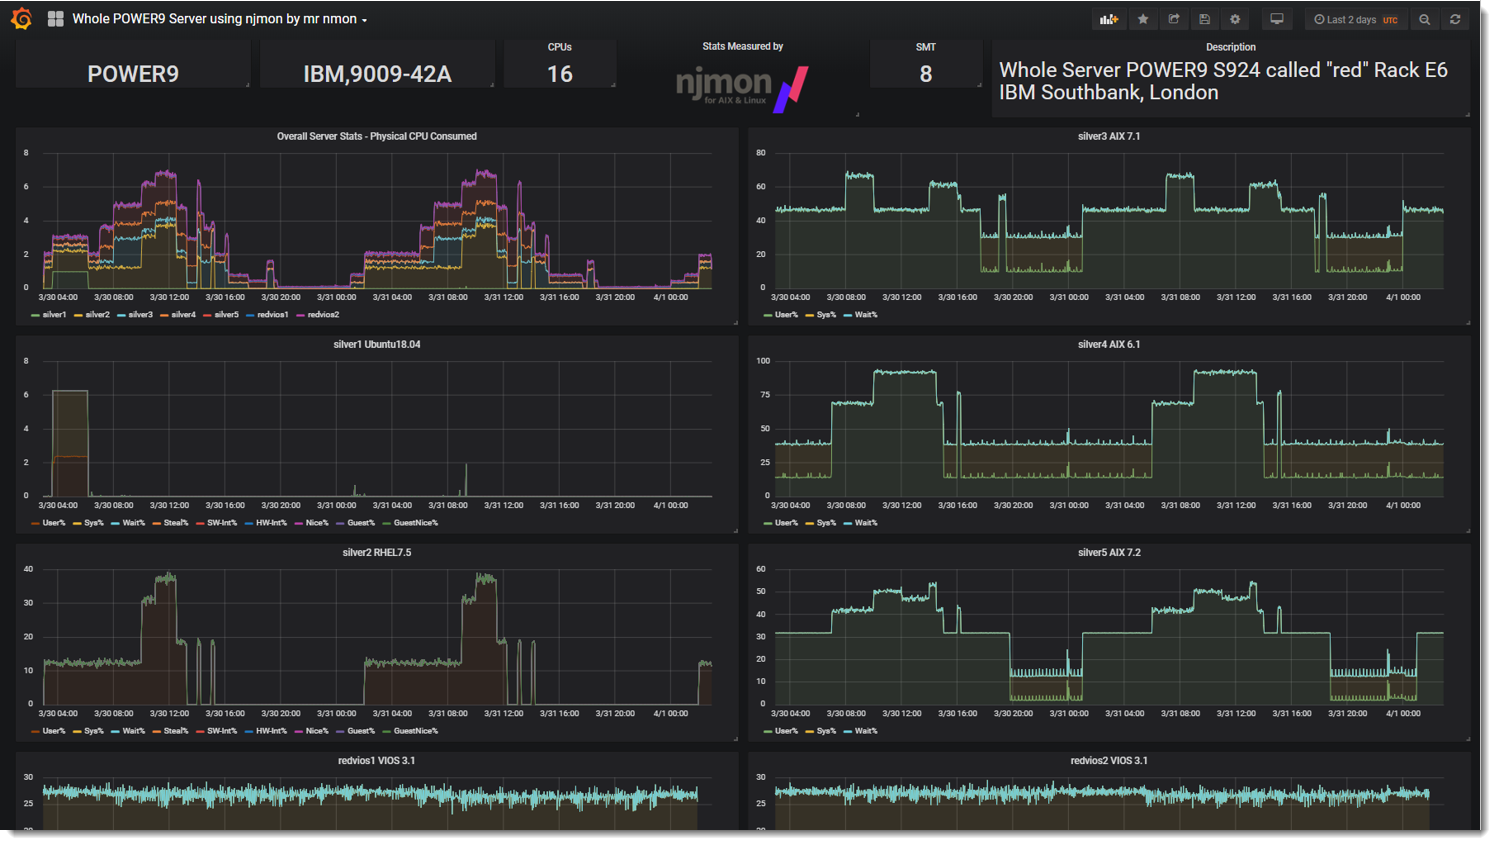
- Dark style
- Server Level top left one line for each LPAR / VM
- Other graphs are for LPARs / VMs CPU details
- Righthand graphs are for AIX LPARs
- Left-hand graphs for Linux VMs
- VIOS at the bottom (just showing)
- Dark style
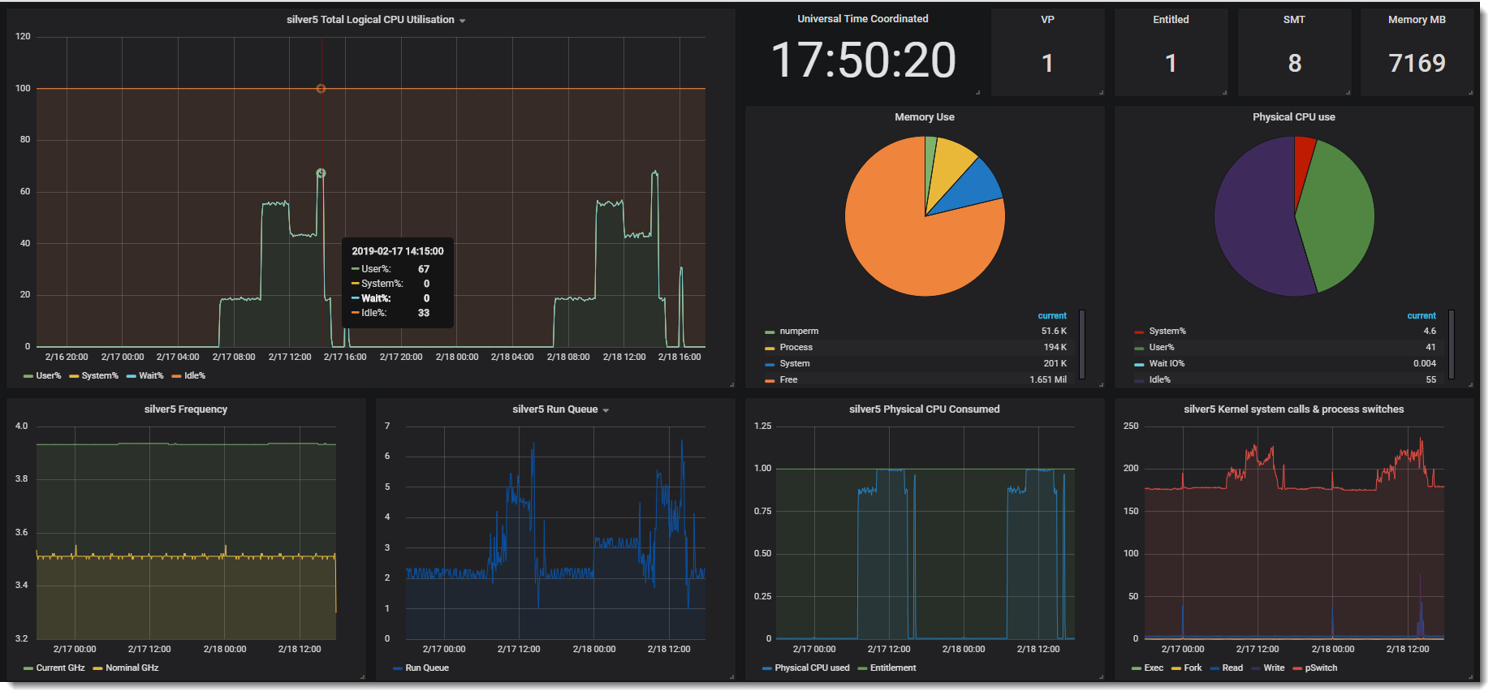
- Single AIX LPAR/VM in more detail
- Graphs Logical CPU Utilisation
- Pie charts for Memory Use and Physical CPU Use
- More Graphs for CPU frequency (GHz), Run queue, Physical CPU consumed, system calls and process switches
|


