
TOPASchart
topaschart - webpage graphs from topas data
 | topaschart is a Korn shell script for AIX or Linux to convert topas/topasrec collected files to a webpage (.html) including Google Chart and JavaScript to display the top 27+ AIX and Linux Performance Graphs and configuration details |
Unfortunately, even if the topas output claims to be nmon like format it is NOT nmon format or anything like it:
- data format wrong,
- memory stats are very different,
- network KB/s,
- packets data merged together etc.
topasrec and topasout commands explained:
By default, AIX captures topasrec files on a daily basis into :
- /etc/perf/daily/
- There should be a load of hostname_date.topas files
- Older files are removed so this should not fill up the file system over time
- These are raw binary data files - don't try to edit them
- DO NOT USE THE RAW FILE with the topaschart command.
- It must be converted to a comma-separated values (.csv) file.
Convert the binary .topas files for "pseudo" nmon style files (.topas.csv) ready for topaschart. using the AIX topasout command like this:
- topasout -a blue_190114.topas
- It will generate blue_190114.topas.csv
- This file is text format so you can edit it with, say, vi blue_190114.nmon
- Like we said above be careful, as this is NOT real nmon format
- Tools that accept real nmon files will more than likely fail on these topasout generated files, for example, nmon analyser or nmonchart
I took the current v22 nmonchart and hacked it for a whole day to get it working with all the various .topas.csv format "mistakes".
Syntax:
- topaschart <nmon-file> <output-file>
For example:
- topaschart blue_150508_0800.topas.csv blue_150508_0800.html
or you could put the .html straight on to your website (assuming Apache is using /var/www/html)
- topaschart blue_150508_0800.topas.csv /var/www/html/blue_150508_0800.html
Here is a simple small sample file so you can see what the graphs look like: sampleX_151030.html
Downloads
| Download File | Comments |
| topaschart_v7.tar | Current version 7 - 1st July 2016 1) Include fixes to work around topasout a bug - some versions don't collect JFS stats 2) Paging stats fixed - wrong columns from VIRTMEM section taken as PAGING numbers - thanks to Alexander Paul (IBM) for finding this one. Note: the ksh script line 5 claims it is version 5 but it is actually version 7 |
| topaschart_v7.zip | Same content as above but a ZIP file |
| Older version | Older version |
| Rmoved | 8th June 2016 Include fixes to work around topasout bugs Thanks to Geert Oost IBM Netherlands for finding and working the fix Improved script help output |
Output file size
Also note nmonchart output files are typically much smaller than the original nmon file. Something like 20% of the size. This is unlike the nmon Analyser file output which can typically be twice the size.
Gallery
Summary of the graphs
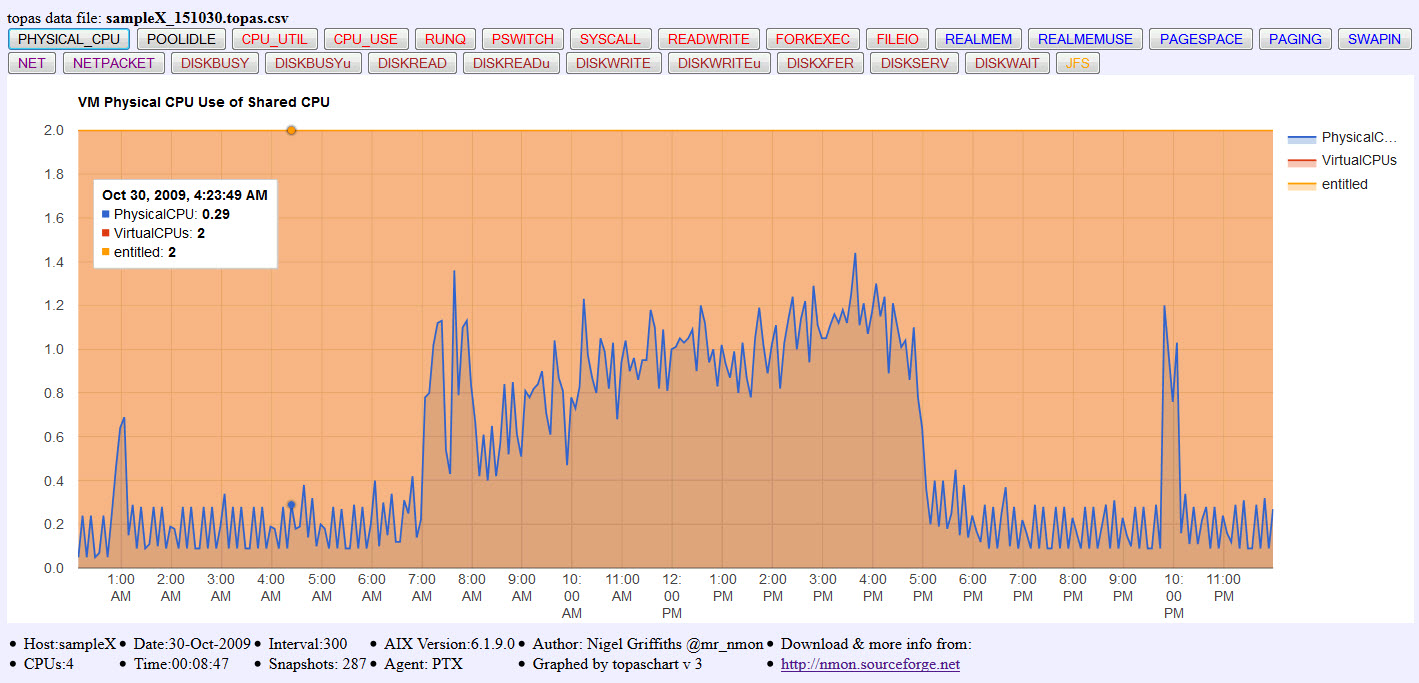
PHYSICAL_CPU - PhysicalCPU, VirtualCPU and entitlement (AIX only LPAR stats))
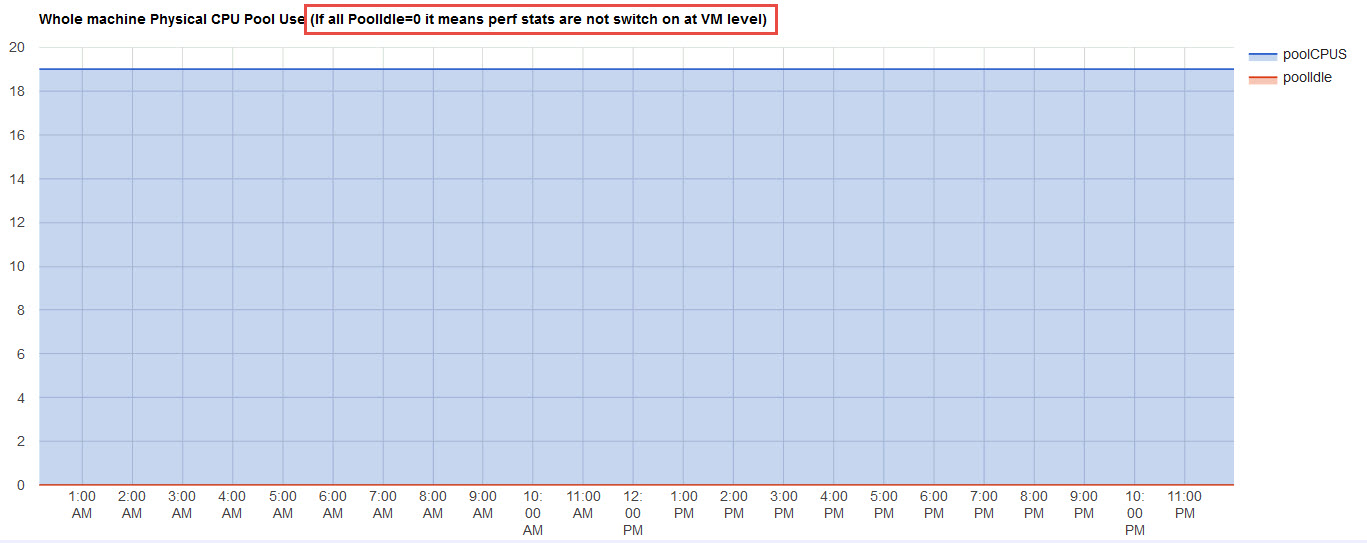
POOLIDLE - If switched on at the LPAR level PoolIdle and Pool CPU count (AIX only
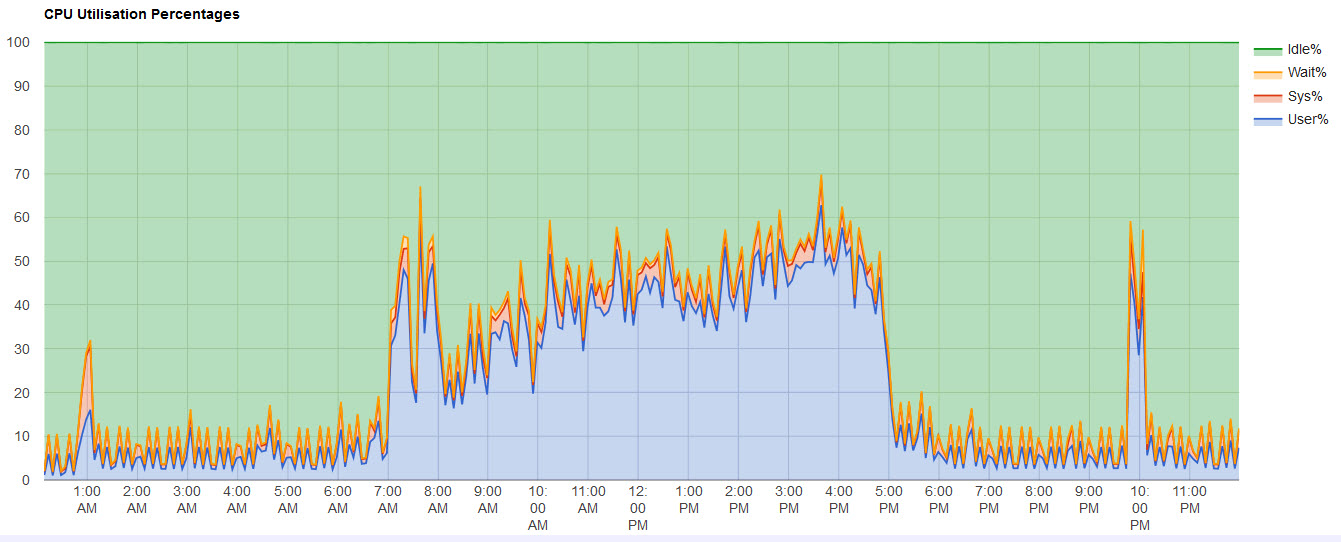
CPU_UTILisation - User%, System%, Wait% and Idle%
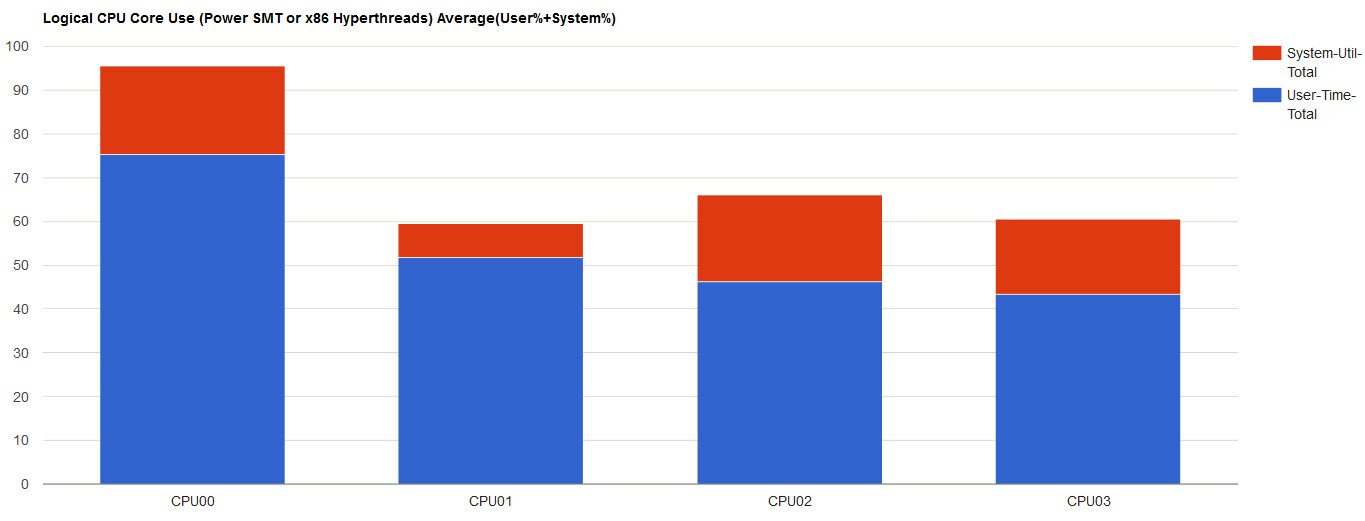
CPU_USE - Logical CPU Core Use (Power SMT or x86 Hyperthreads) Average(User%+System%)
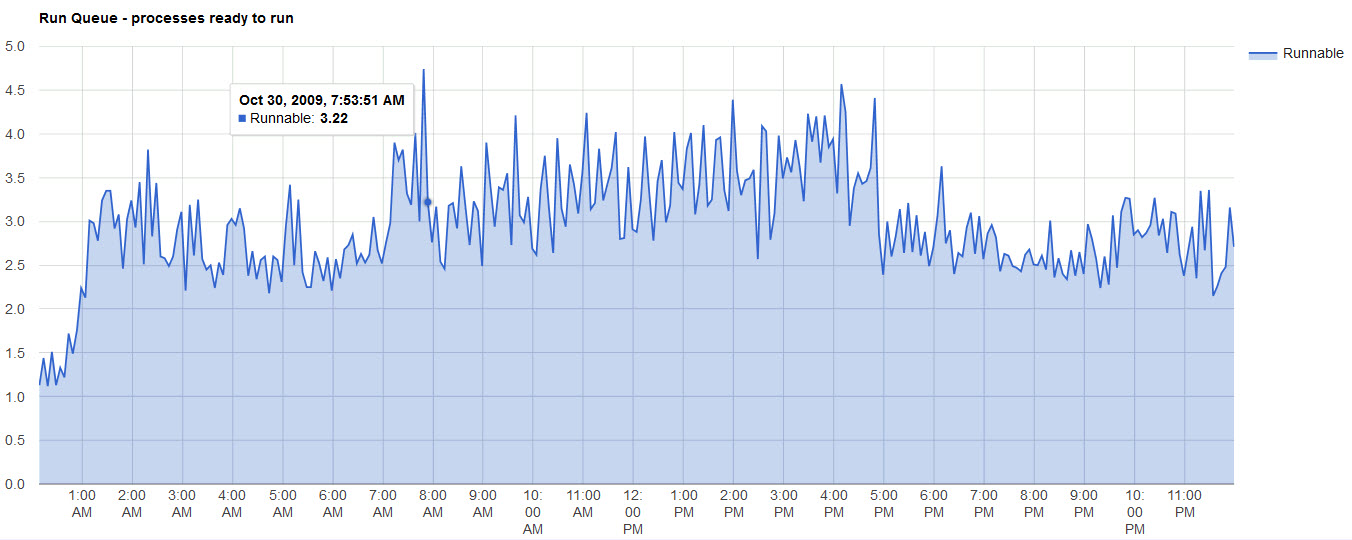
RUNQ - Run Queue in number of processes
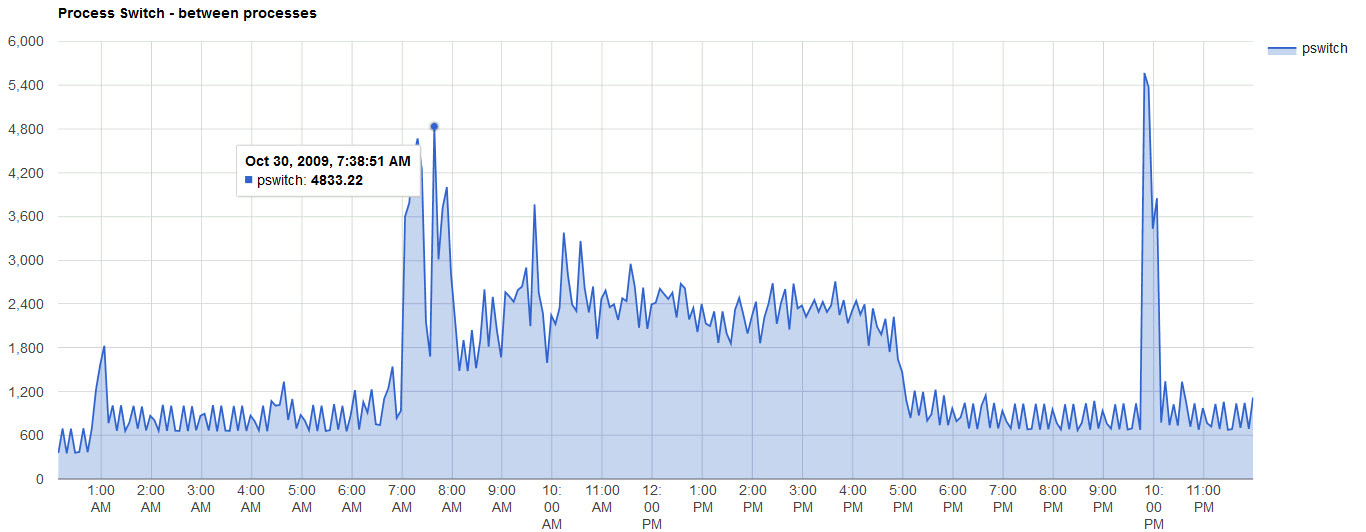
PSWITCH - Process Switches as the kernel rns different programs
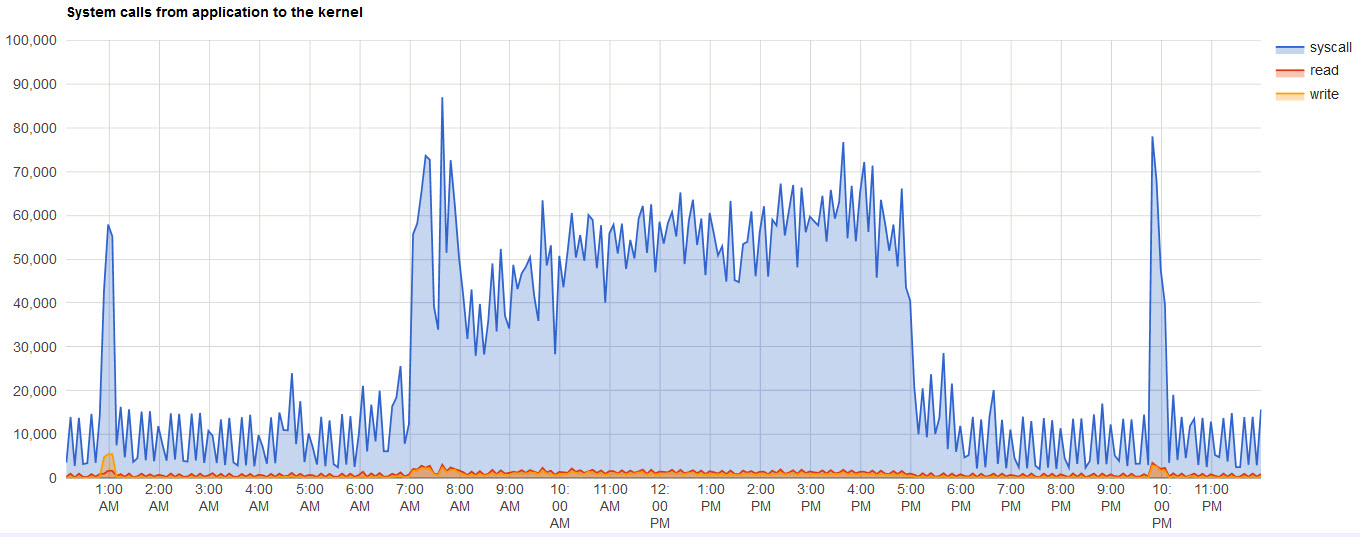
SYSCALL - Systems calls of processes requesting Kernel operations - Total and read, write calls
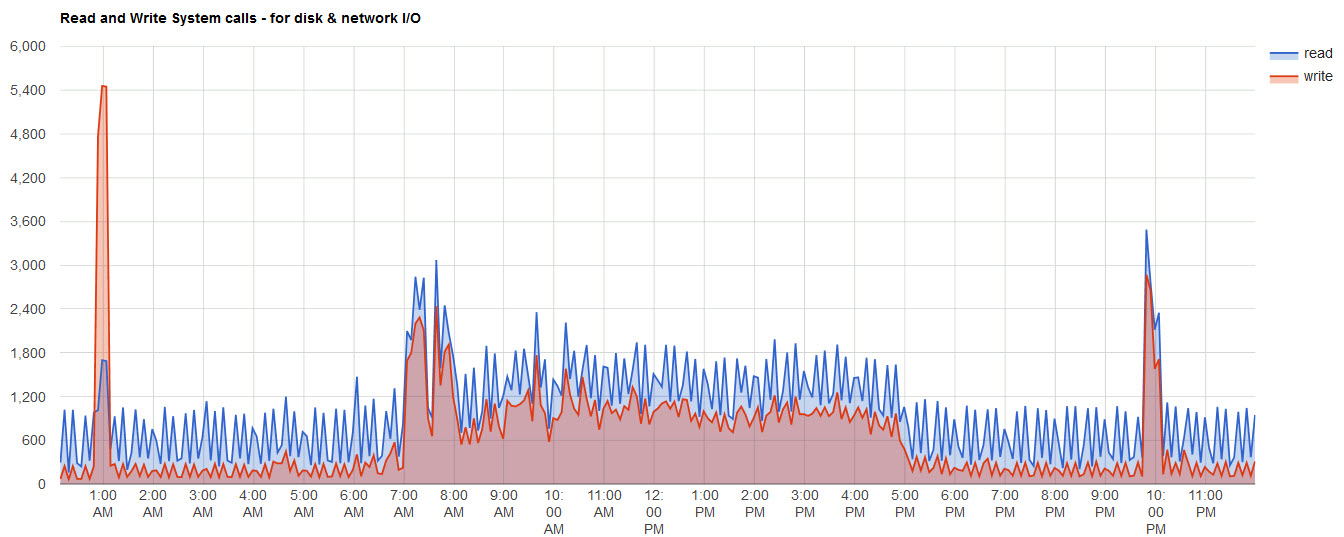
READWRITE - Read and Write System calls only
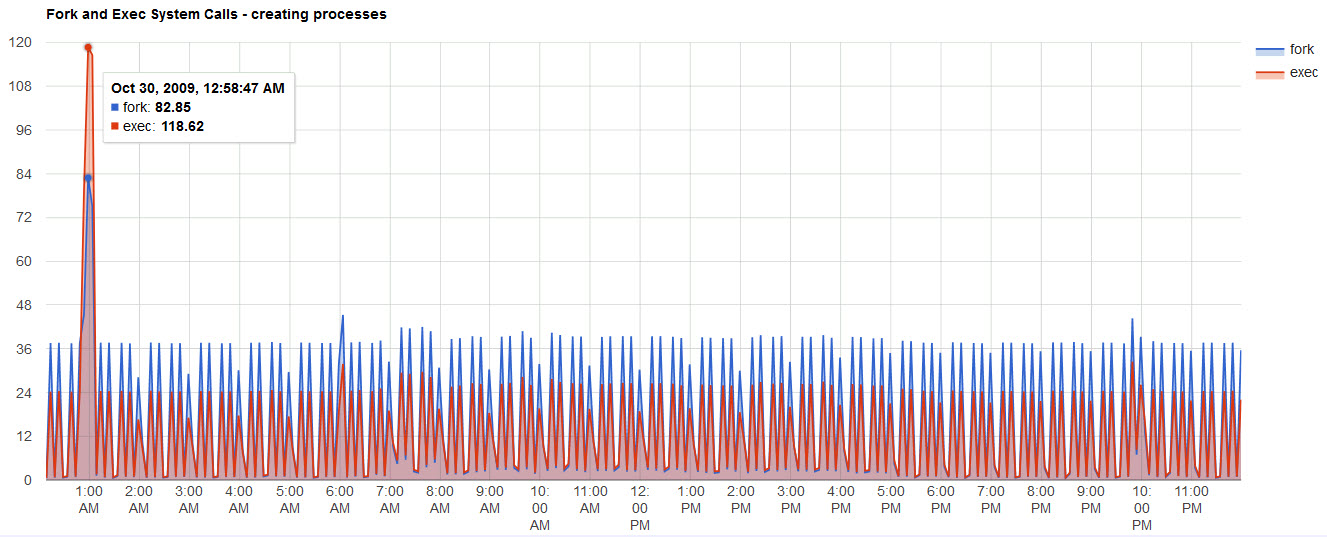
FORKEXEC - Systems call fork (duplicate a process) and exec (overwrite current process with a new program)
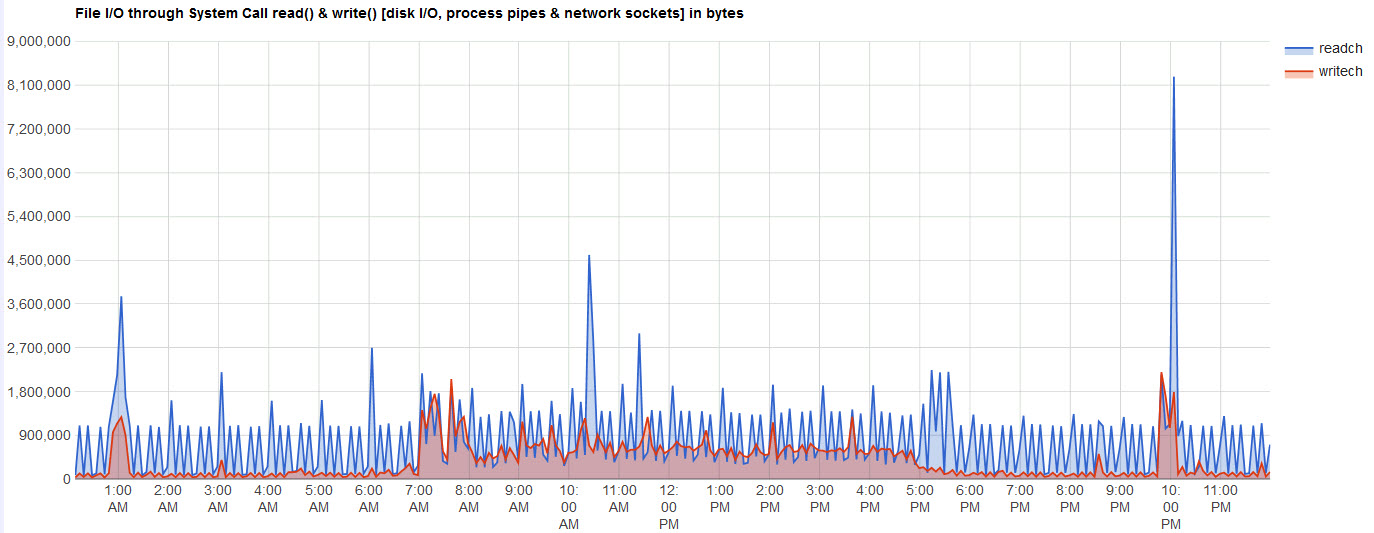
FILEIO - System call - number of bytes on the read + write system call - includes disks, networt sockets and pipes
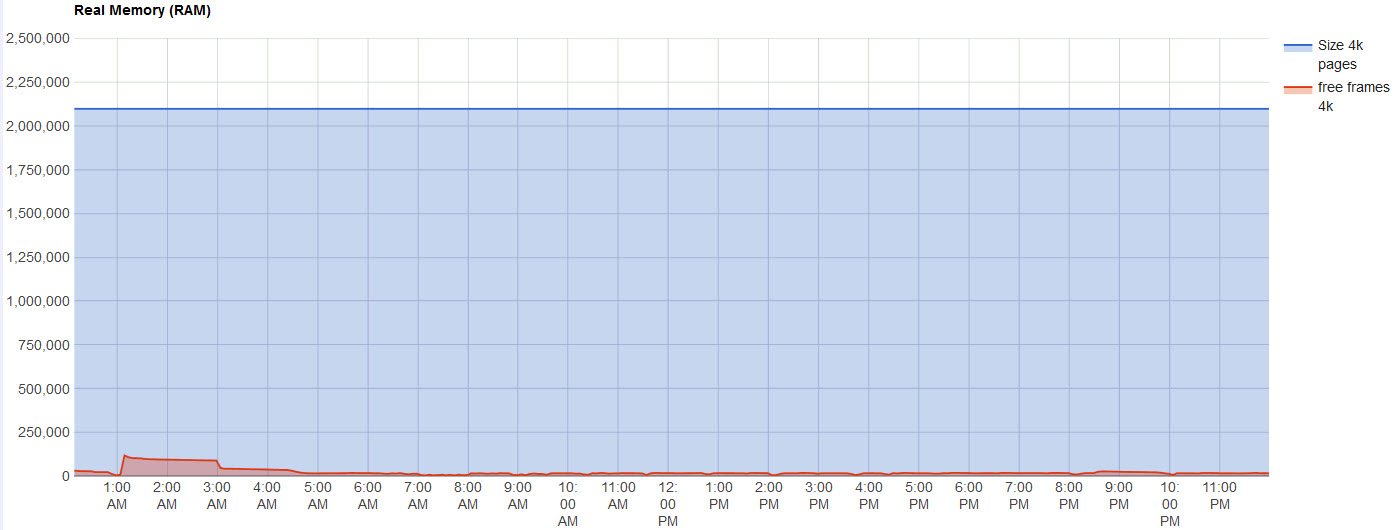
REALMEM - Total RAM (MB) and Free RAM (MB) (AIX only)
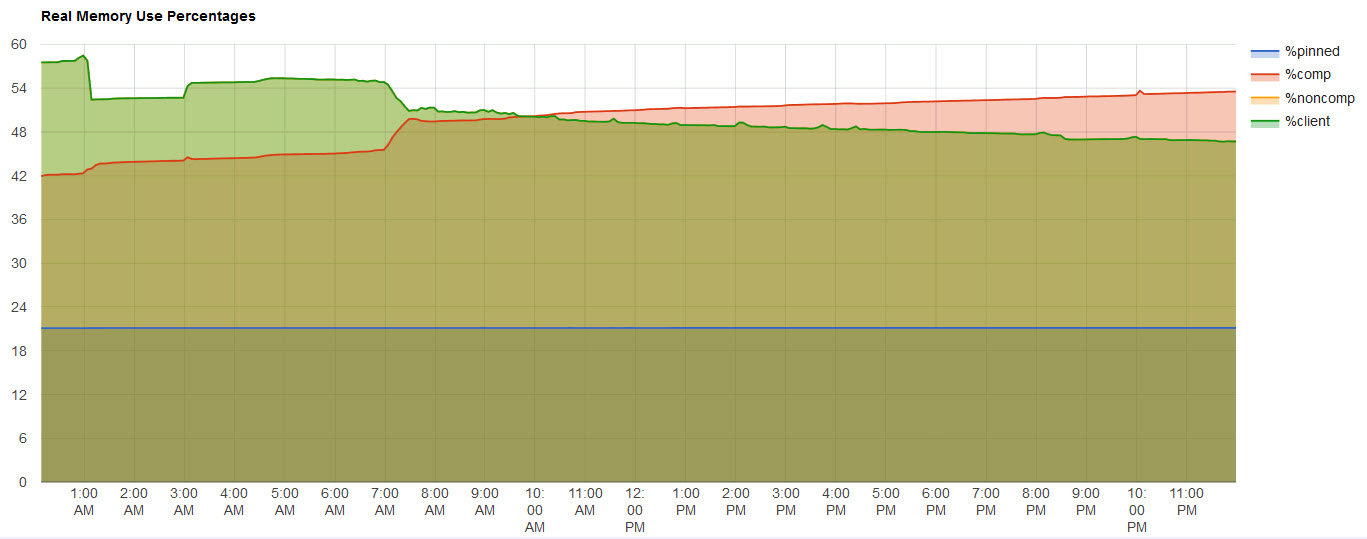
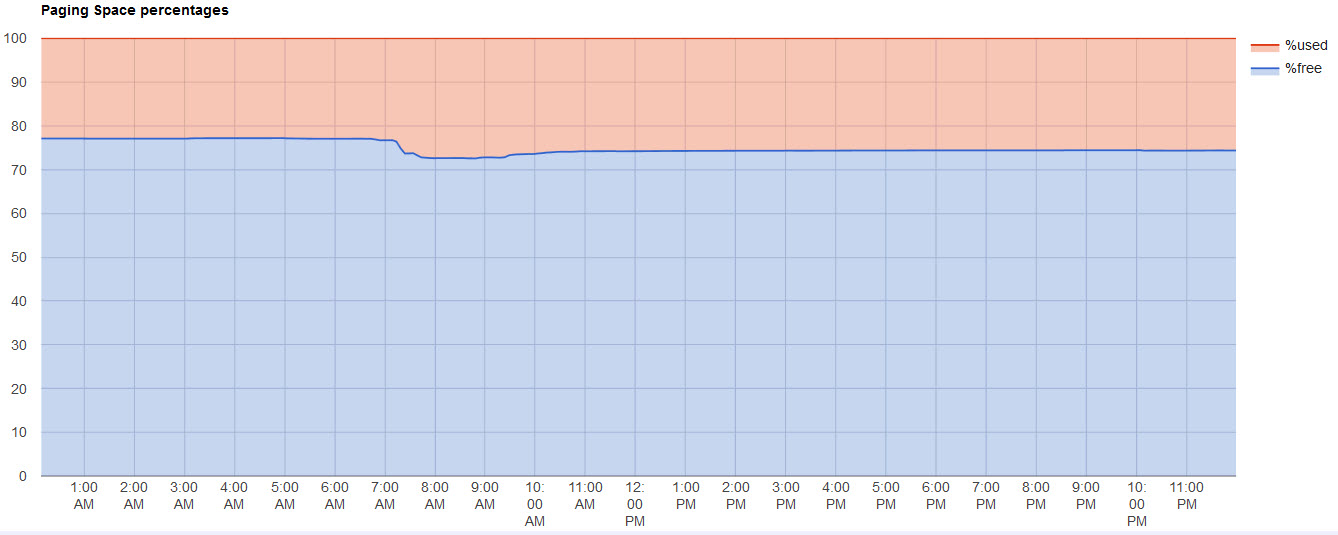
REALMEMUSE - Virtual memory (paging space) Total and Free
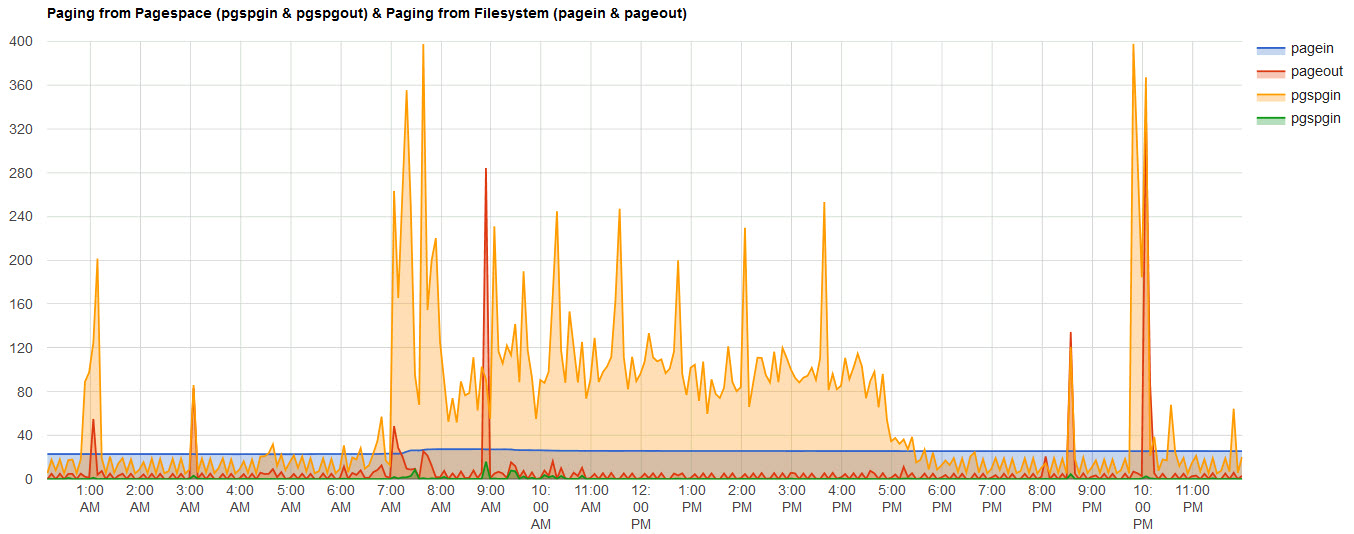
PAGING - Paging space: pages in (pgin) and out (pgout) plus Filesystem paging: in (pgsin) and out (psout)
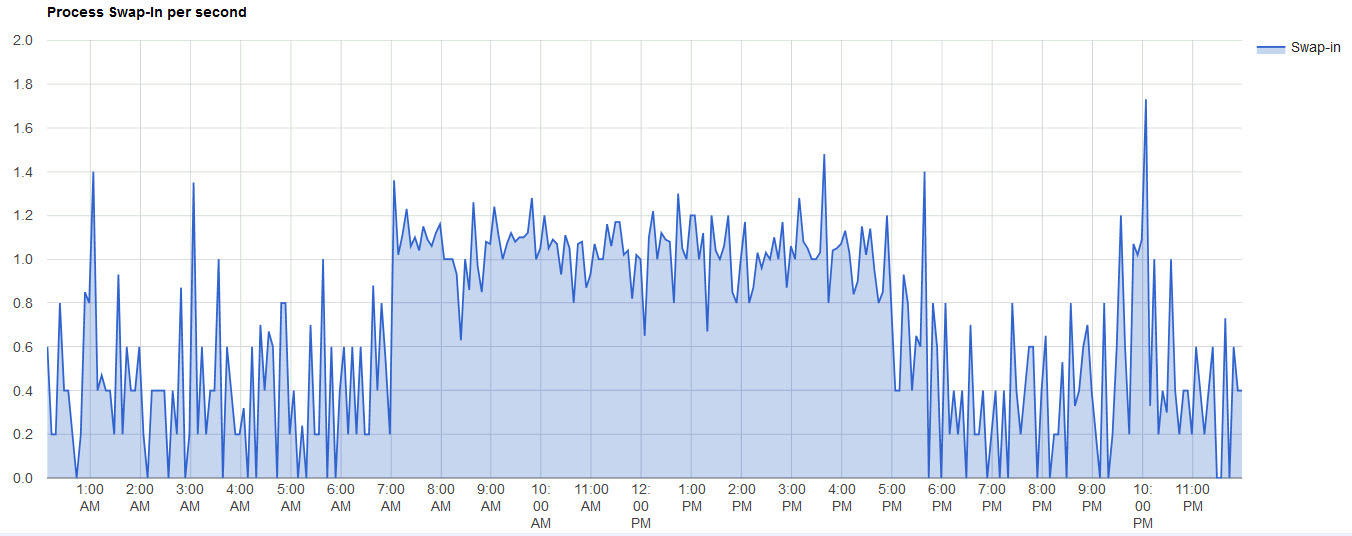
SWAPIN - Process swap back in to memory per second
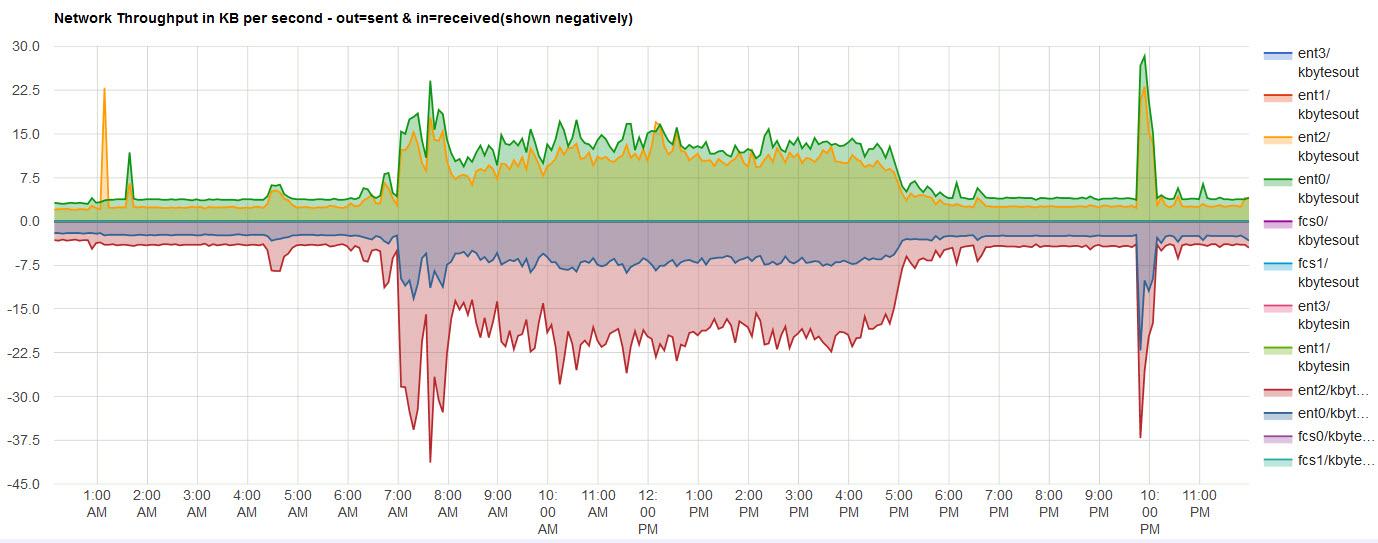
NET - Network throughput read and write for each network in KByes per second
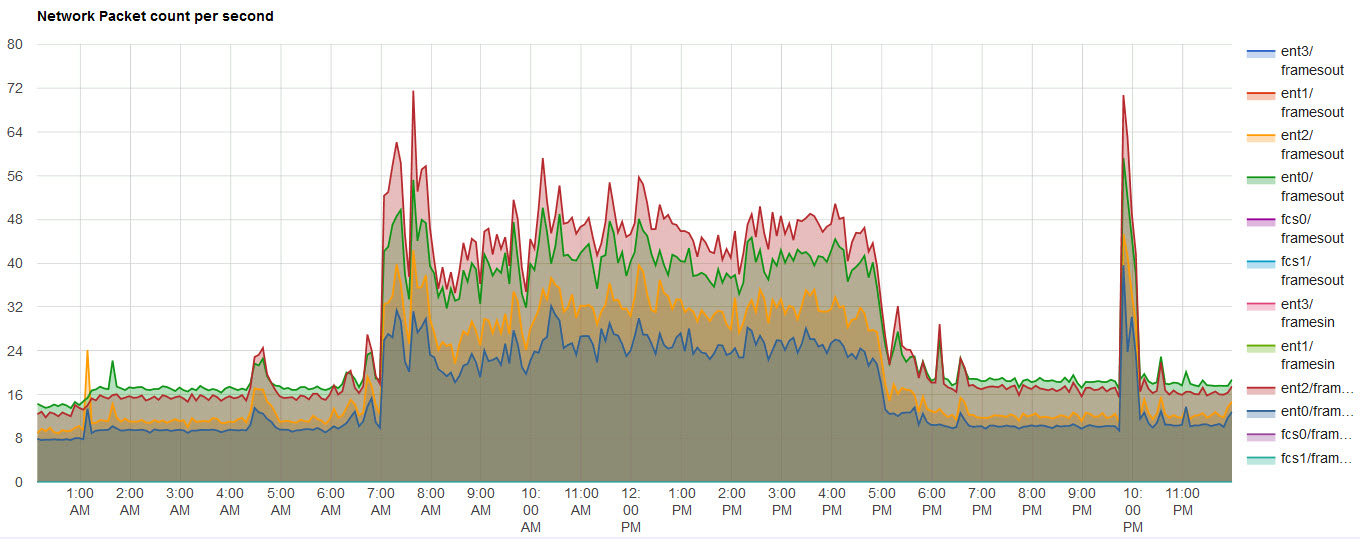
NETPACKET - Numbers of read and write packets per second for each network
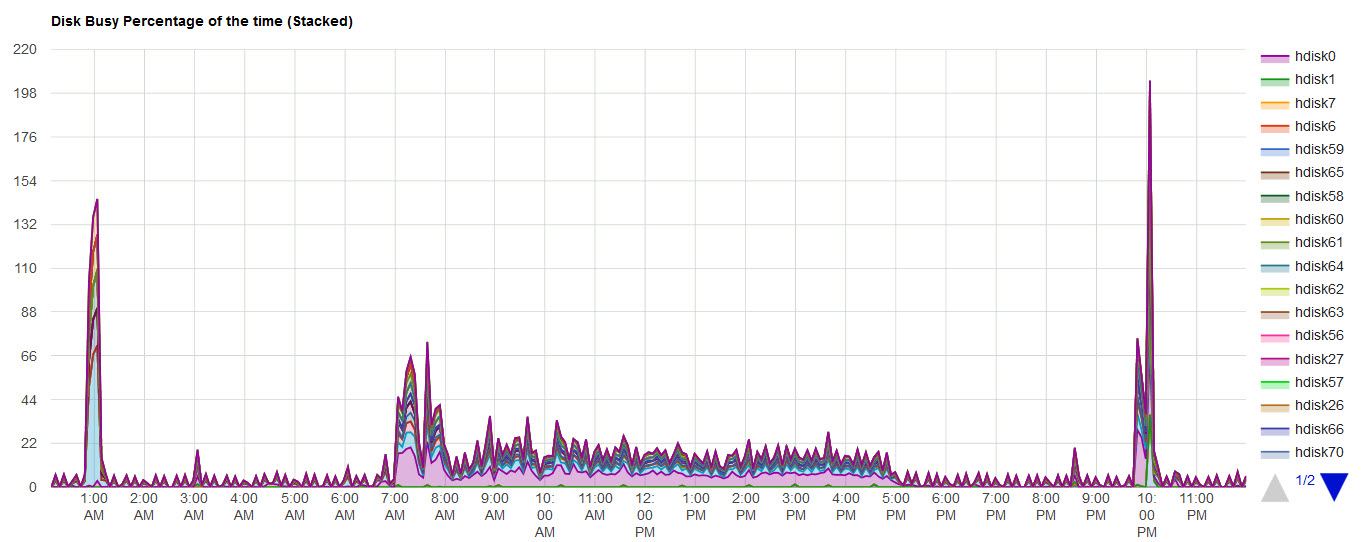
DISKBUSY - Disk busy percentage for each disk - Stacked lines
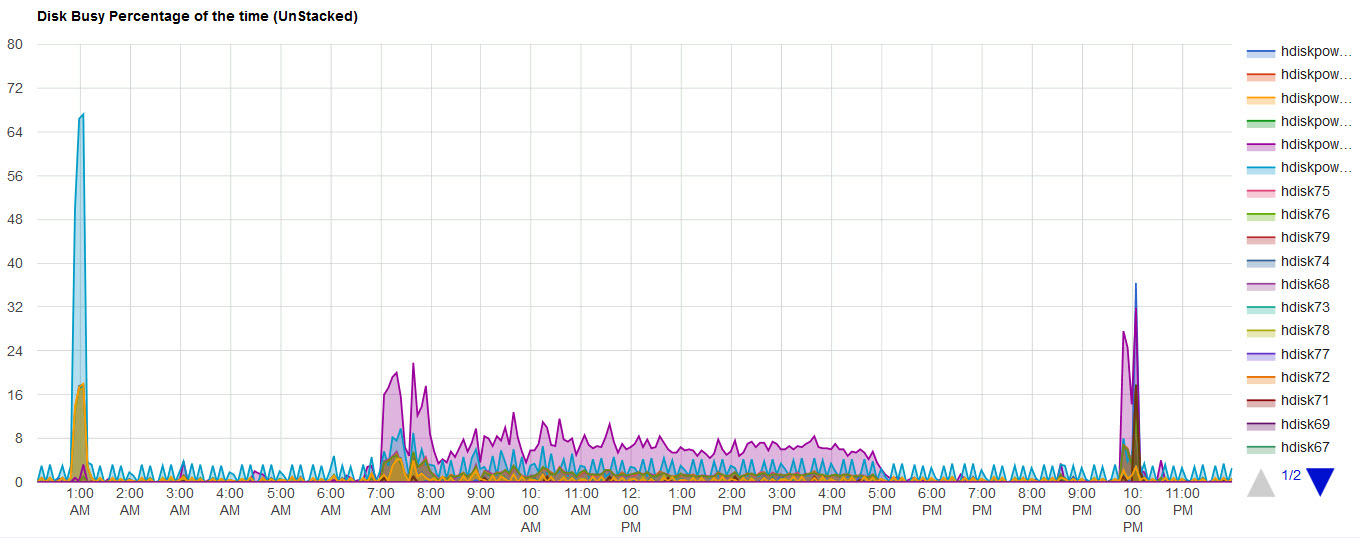
DISKBUSYu - Disk busy percentage for each disk - Unstacked lines
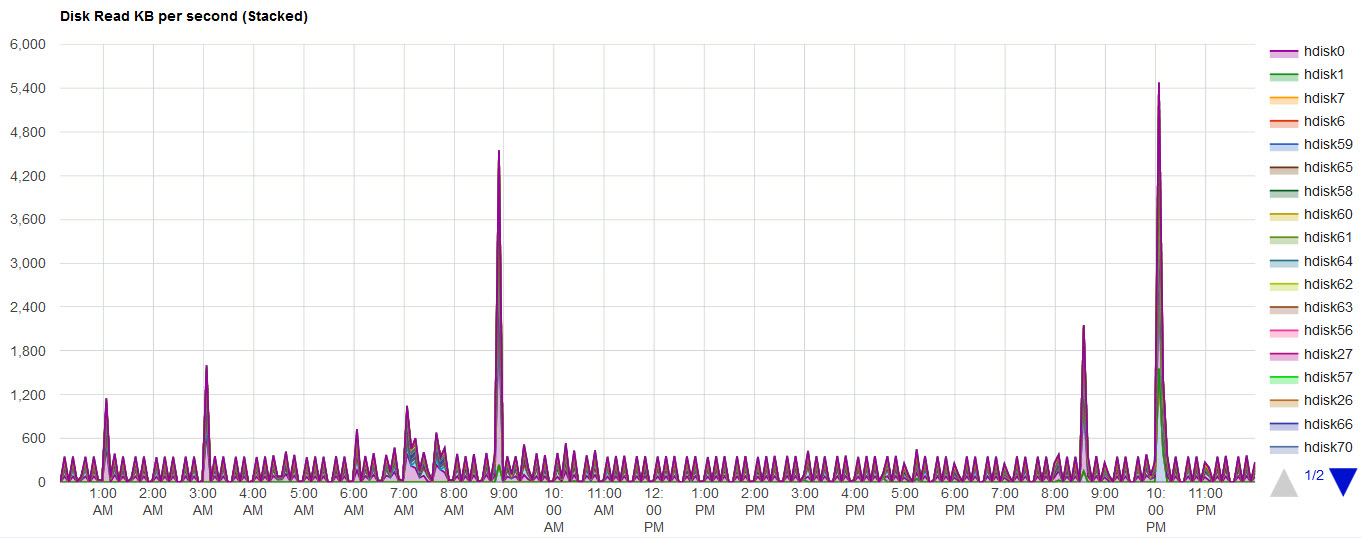
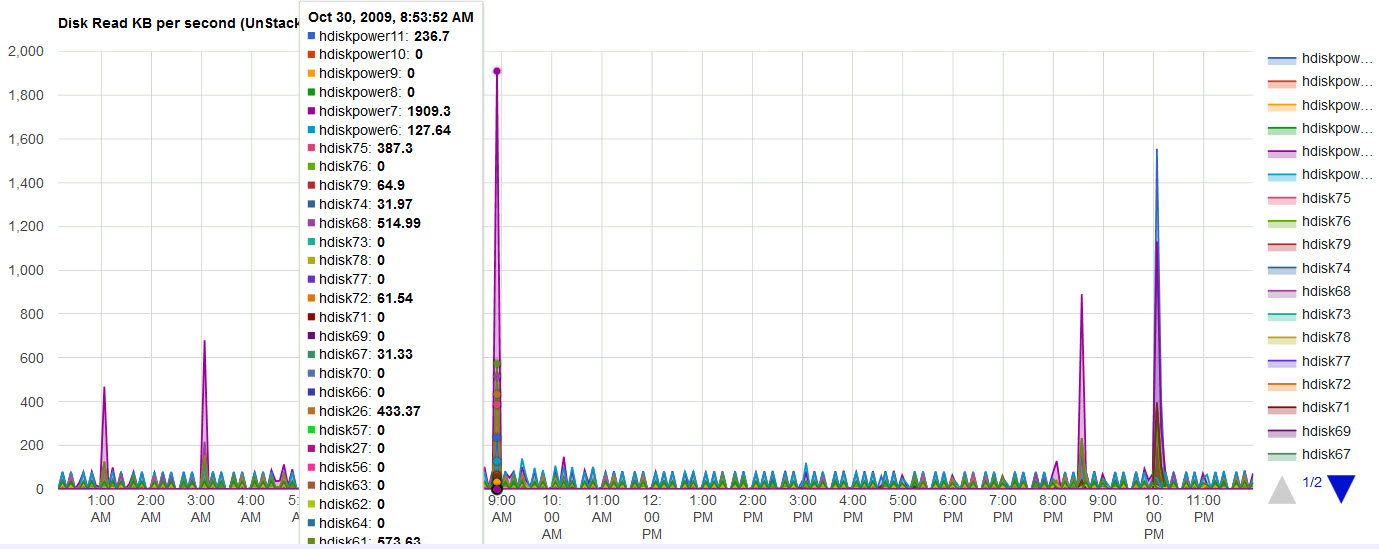
DISKREAD - Disk read throughput in KBytes per second for each disk - Stacked lines
DISKREADu - Disk read throughput in KBytes per second for each disk - Unstacked lines
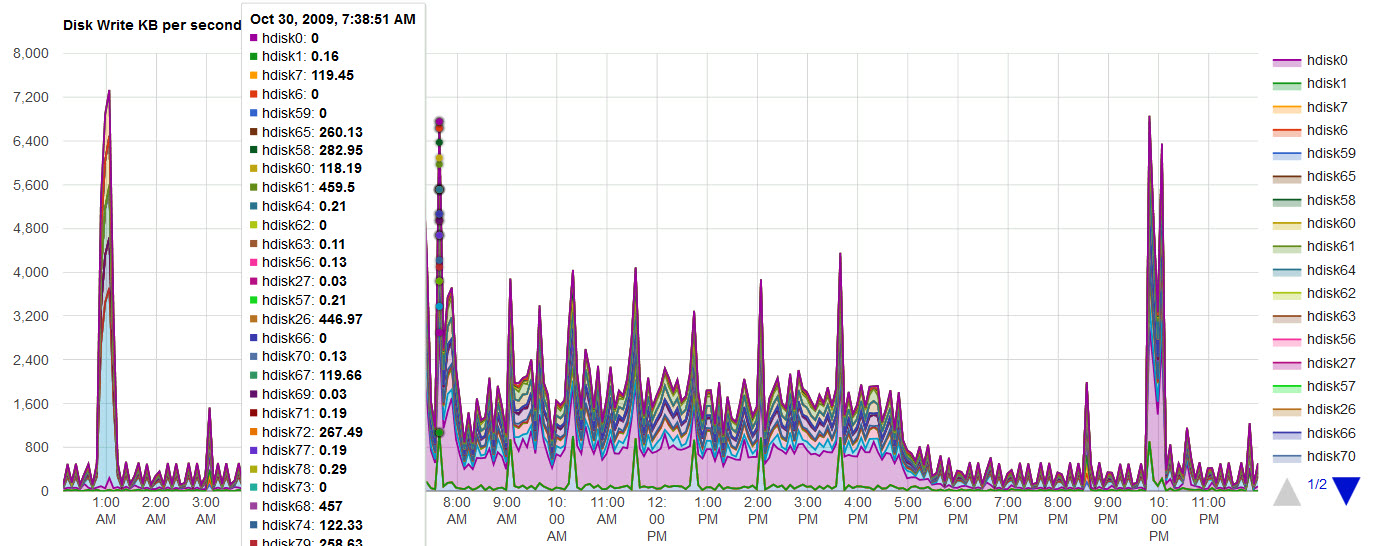
DISKWRITE - Disk write throughput in KBytes per second for each disk - Stacked lines
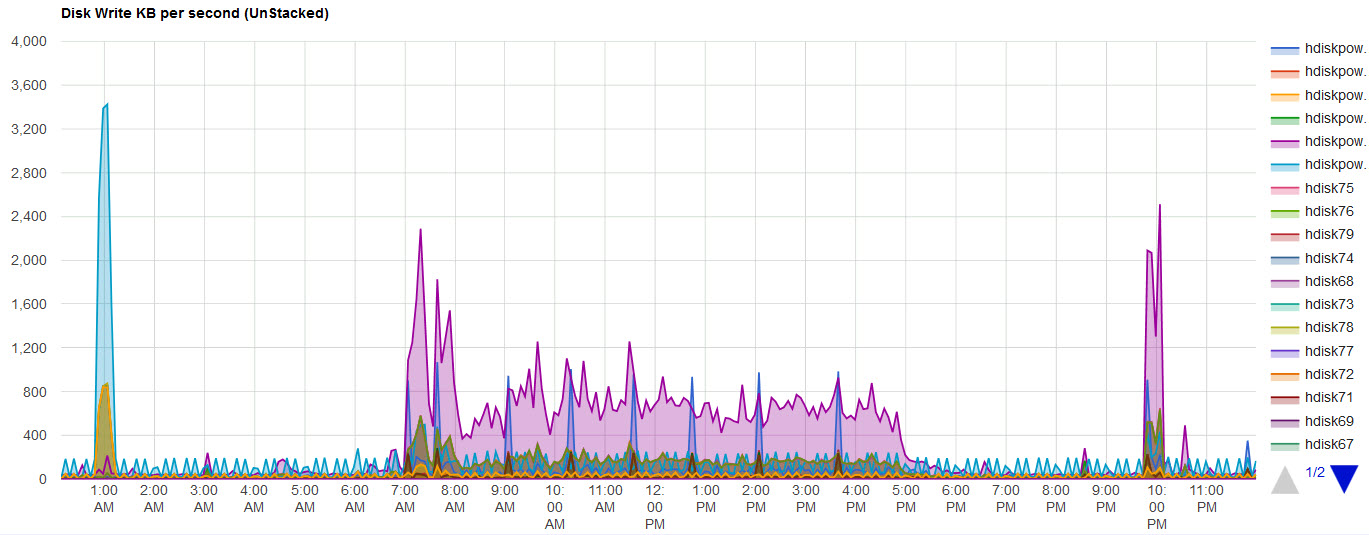
DISKWRITEu - Disk write throughput in KBytes per second for each disk - Unstacked lines
DISKBSIZE - Disk block sizes
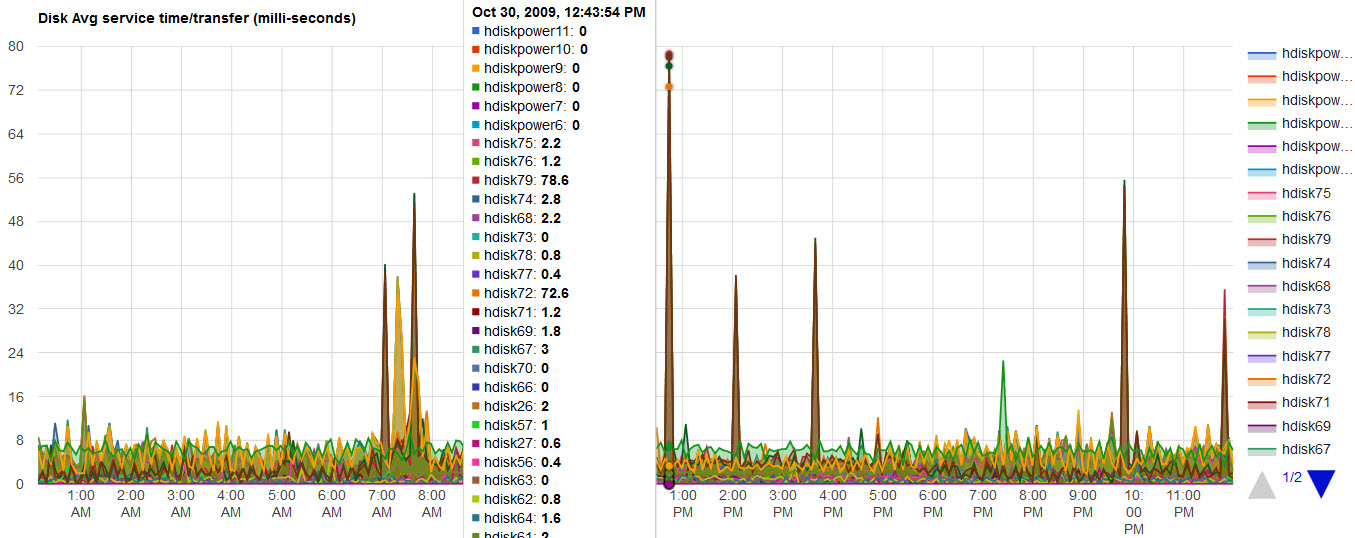
DISKSERV - Disk Service times in milliseconds
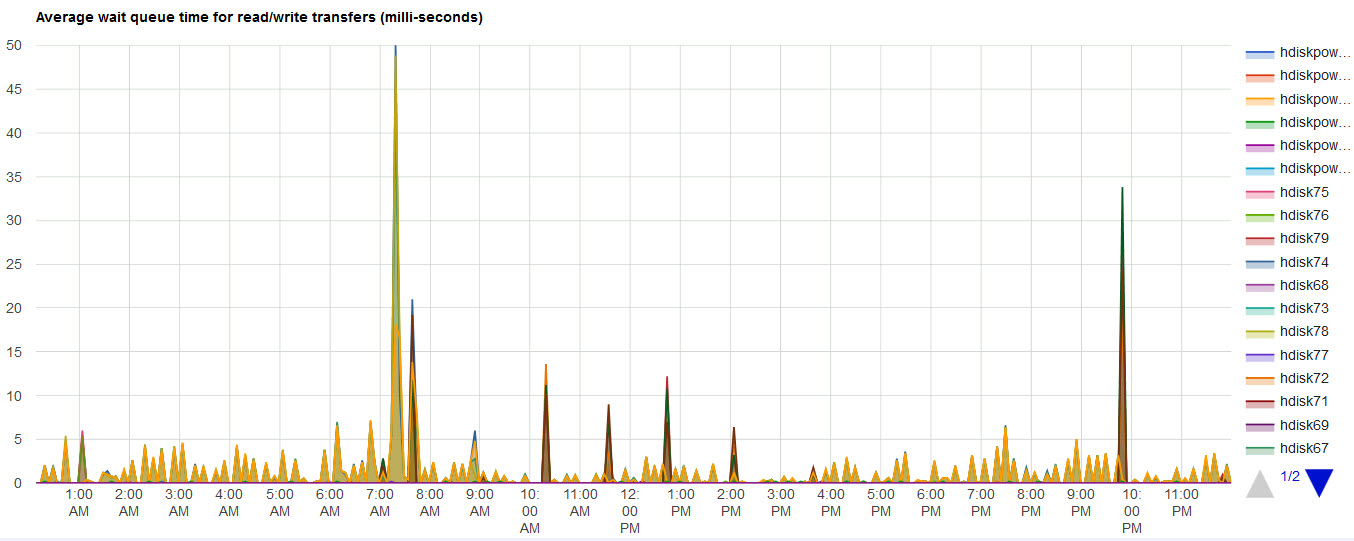
DISKWAIT - Disk Wait times in milliseconds
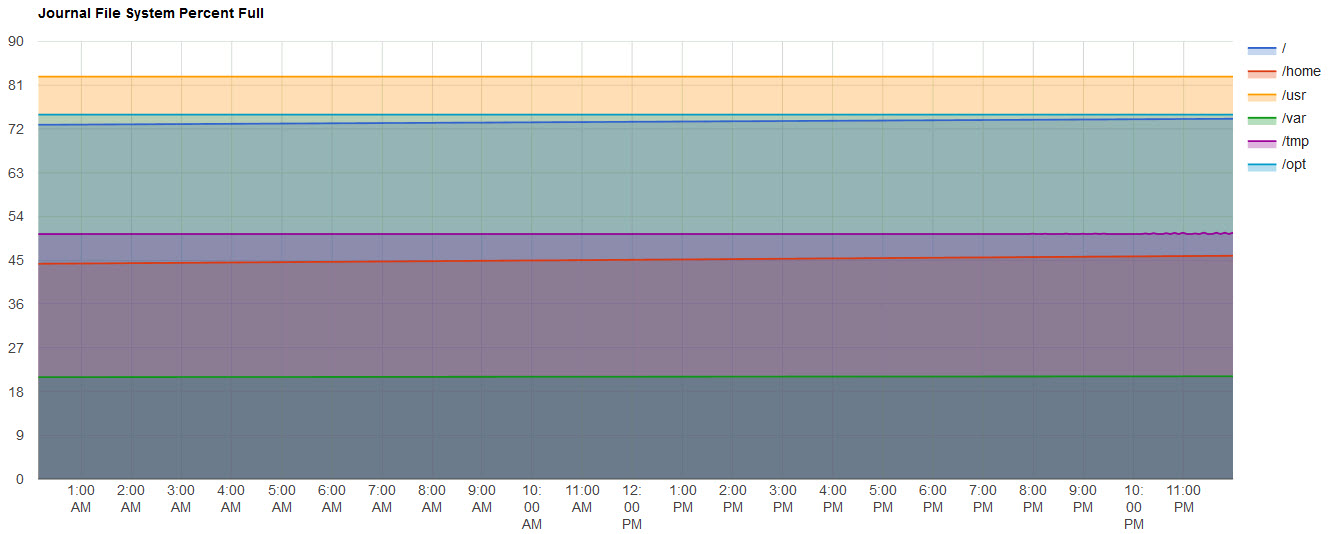
JFS - Journaled Filesystem Percent Full