
Nmonchart
nmonchart - webpage graphs from nmon data
 | nmonchart is a Korn shell script for AIX or Linux to convert nmon collected files to a webpage (.html) including Google Chart and JavaScript to display the top 60+ AIX and Linux Performance Graphs and configuration details |
Syntax:
nmonchart <nmon-file> <output-file>.html
For example:
nmonchart blue_150508_0800.nmon blue_150508_0800.html
New:
nmonchart blue_150508_0800.nmon- if you miss out the output filename is will use the source filename and replace .nmon with .html
Or you could put the .html straight on to your website (assuming Apache is using /var/www/html)
nmonchart blue_150508_0800.nmon /var/www/html/blue_150508_0800.html
Online Immediate nmonchart generated graphs - a Website on the Internet
- Don't want to download code, run KSH scripts on AIX or Linux? Too much like hard work?
- Use the nmonchart online service:
- Upload your nmon file using your browser
- . . . Wait a couple of seconds
- Your browser gets sent the nmonchart graphs
- Job Done!
- This is running at https://mr-nmon.com/nmonchart.html
Here is a simple, small sample file so you can see what the graphs look like:
- sampleC.html - Note: small sample and quick to load, but some data faked to make the graphs look good (not largely full of zeros).
- sampleD.html - Note: large real-life sample and can take a few seconds to load
- These samples and the original .nmon files are in the download files below.
Note:
- IBM Lab Services regularly uses nmonchart to perform Power Systems Health-Checks (among many other tools).
- As a service offering, you can get a System Admin / Performance specialist at your site to make tuning recommendations about your Power Server(s).
- And they can show you how to install and use nmonchart.
|
Haven't got access to AIX or Linux! Don't worry, you can use VirtualBox to run Ubuntu for free on your PC or Laptop:
On Ubuntu, run nmonchart as below: ./nmonchart sampleC.nmon |
Below are:
- The download details on the nmonchart .tar file (4 MB), including the history of updates
- Gallery of the graphs produced (click on the small images for details)
- The README for the latest version(included in the download package)
Downloads
| Download File | Comments |
| nmonchart44.tar | Current Version 44 - 10th Feb 2026 New Features of nmonchart version 43 - The AIX "sed" command lacks the "\r" escape sequence, so rolled back the use "^M" -- It oddly removed "r" characters. - Removed the "Q and Q" in the Linux Version at the bottom. |
| nmonchart43.tar | Version 43 - 10th Feb 2025 New Features of nmonchart version 43 - Apple macOS support and other strange UNIX flavours with ksh with a strange directory - LARGE nmon files = meaning more than 9999 snapshots in a file. -- Big thanks to Ivor Goncharov for these code fixes and advanced awk options. -- Change to awk that deals with Timestamps to use RSTART & RLENGTH, which allows Timestamps more than T9999, i.e. four digits. - Note: use "nmon -w digits" option (now also available in nmon for Linux 16r onwards) to set the number of digits in the Timestamp (T numbers used in ZZZZ lines). -- Suggest: -w 6 for up to 999999 snapshots. -- This stops ordering problems on T9999 to T10000 boundaries & T99999 to T100000 etc. Graphs of 10,000 datapoints with a screen of 1920 pixels wide are "challenging"! -- But does work now, thanks to Ivor - the screen updates can take a few seconds. - Clean up one large sed command for readability and small corrections. |
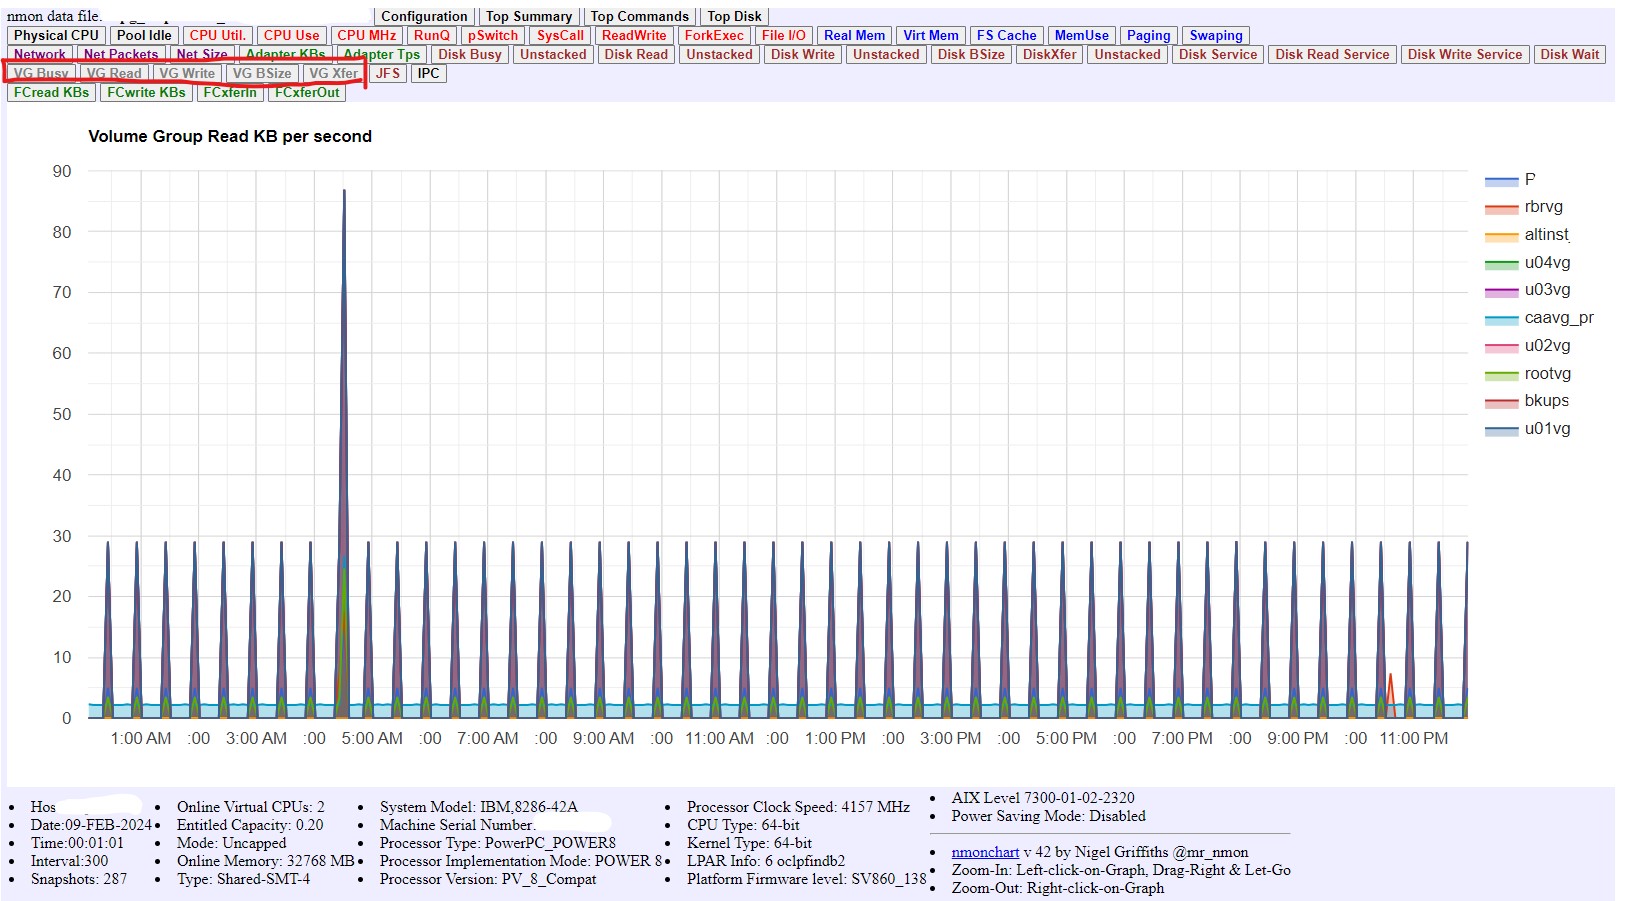
| nmonchart42.tar | New Features of nmonchart version 42 from 2024 - Support for AIX Volume Groups stats. Example graph: nmonchart42_volumegroup.jpg - This requires capturing with the nmon -A option on AIX. - Small bug fixes to handle some odd formatting in nmon files. |
| Removed | New Features of nmonchart version 40 from 2023 - Support for VIOS SEA, VIOS SEA Packet and VIOS SEA Physical Network. Example: redvios1.html - This requires capturing with the nmon -O option on the VIOS. - These and Fibre Channel (FC) stats buttons go on a new line - if found in the .nmon file. - Change the threshold from 5.0 to 0.05 on CPU_USE graphs. |
| Removed | Old Version 39 - 19th Nov 2019 New Features of nmonchart version 39 - Support for AIX 7.2 TL4+ CPUMHZ stats (Higher MHz used in CPU Max Mode on POWER9). - Note: you must add the -y dfreq=on to the end of the nmon command line |
| Removed | Old Version 38 - 12th Oct 2019 New Features of nmonchart version 38 - Added Disk Transfer (DISKXFER) graph to have both Stacked and Unstacked graphs - Clearer Zoom In/Out details |
| Removed | Old Version 37 - 13th Sept 2019 New Features of nmonchart version 37 - Correction to the Paging rate graph title (thanks to Alan Wilcox for reporting this confusion) to -- "All Paging (pgin & pgout) & Paging from Paging Space only (pgsin & pgsout) per second" - Change Logical CPU USE (SMT) to ignore values below 5% -- highlights real use of the SMT threads + new title & ignores SMT threads which are just ticking over -- change graph title to explain this Average Use of Logical CPU Core Threads POWER=SMT or x86=Hyperthreads (ignoring values below 5%) - Typo transers to transfers |
| Removed | Version 35 - 13th Feb 2019 - Good speed up in performance - especially with large numbers of snapshots - thanks to Klaus Franke - Added four AIX Fibre Channel Graphs by request. Note, you need to run nmon with the -^ to include FC stats. -- FC READ & WRITE KB/s and FC TRANSFERS IN and OUT/s - Removed the need for the 2nd parameter. It uses the 1st parameter & will replace the .nmon with .html -- If not ending in .nmon it just added the .html anyway. |
| Removed | Version 34 - 4th July 2018 - Fix to TopDisks by adding the paste command -d, option - Added to Linux nmon files from PowerVM (POWER hypervisor) PhysicalCPU and Shared CPU Pool Free graphs - Thanks to Enrico Joedecke for the above fix and suggestion - For Linux, the RunQueue graph includes Blocked processes - JFS data "nan" short for "not a number" (usually not a real filesystem) replaced with -1.234 so graphs work |
| Removed | Version 33 - 4th Nov 2017 - Added Top 15 Disks Graph - particularly useful if the data has 100's or 1000's of disks |
| Removed | Version 32 18th Oct 2017 - Added for AIX a new memory graph for System%, Process%, Cache% and Free%. Note: In the nmon Analyser, it is the MEMNEW graph. - Added handling for single GPU (normally in pairs) |
| Removed | Version 31 - 9th Dec 2016 - Fix for Top Processes sort arguments for Linux, which handles -t differently, resulting in not having the Top 20 processes on Linux. - Fix Linux machines with no disks reported in AAA,disks,0 line - we skip graphing the disks. - Added sampleD.nmon and sampleD.html as a much larger & more interesting set of nmon stats. - Note: sampleC had some stats faked up by me! |
| Removed | Version 30 - 22nd Sept 2016 Fix for running the nmonchart Ksh script on Linux. AIX has a "print -n" option, but Linux does not. |
Gallery
 |  |  |
 |  |  |
 |  |  |
 |  |  |
 |  |  |
 |  |  |
 |  |  |
| nmon version 16 additional stats and nmonchart 24 graphs | ||
| All ten Linux Utilisation stats | MHz changing on a S822LC | |
 |  | |
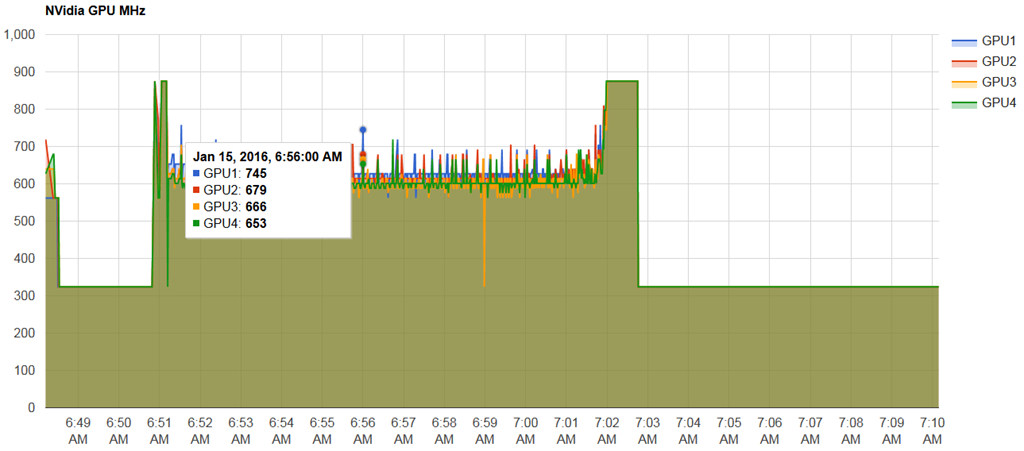
| nmon version 16 Nvidia GPU support on S822LC | ||
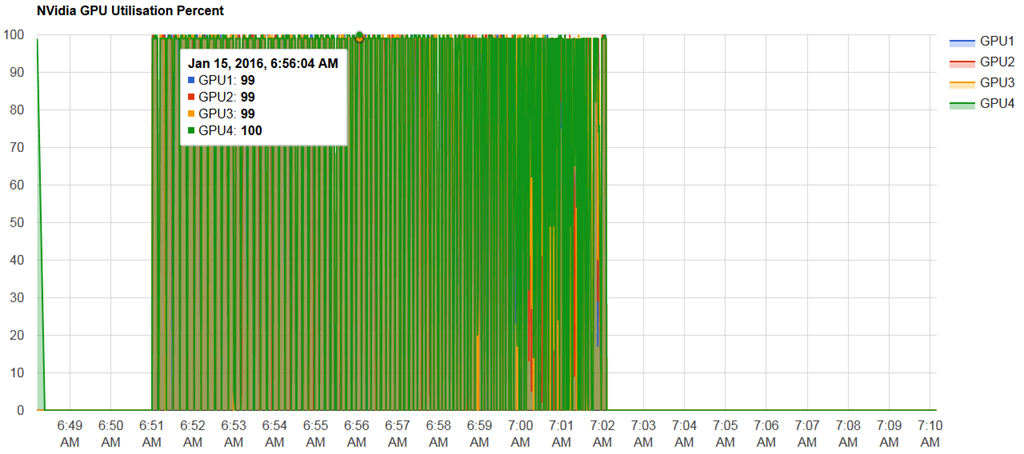
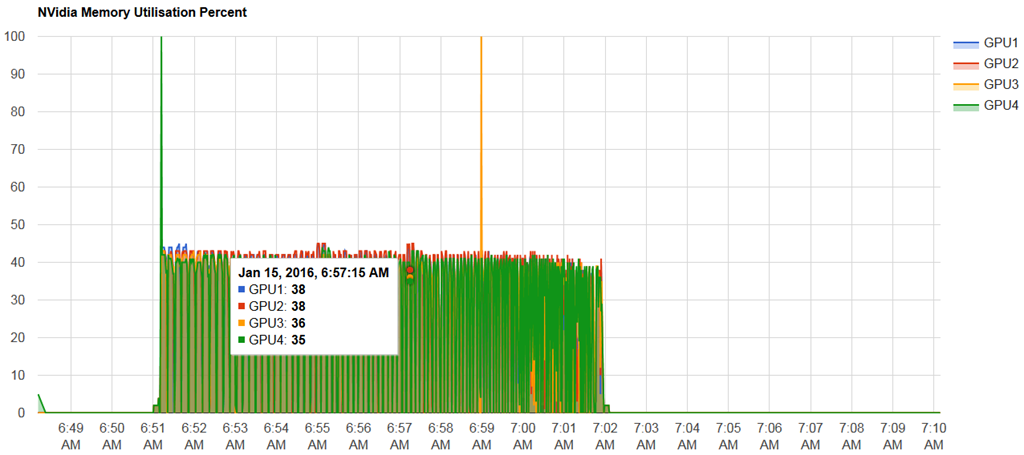
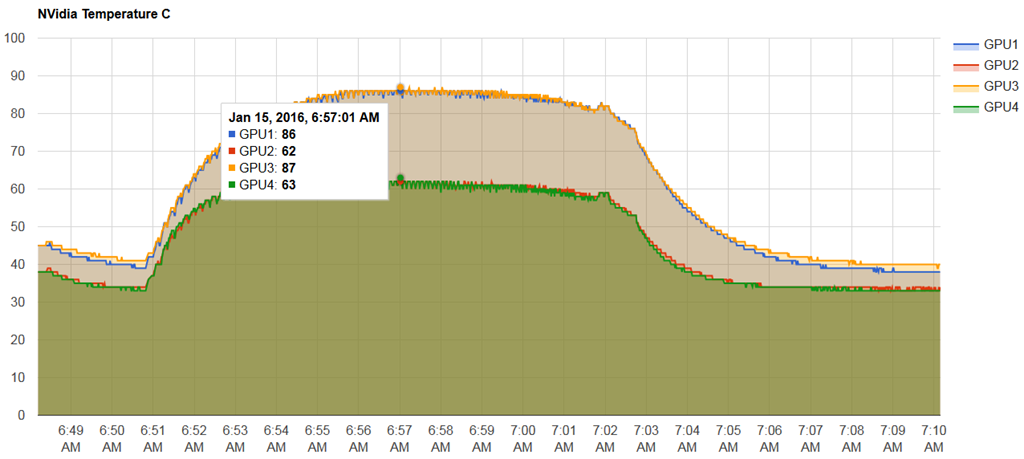
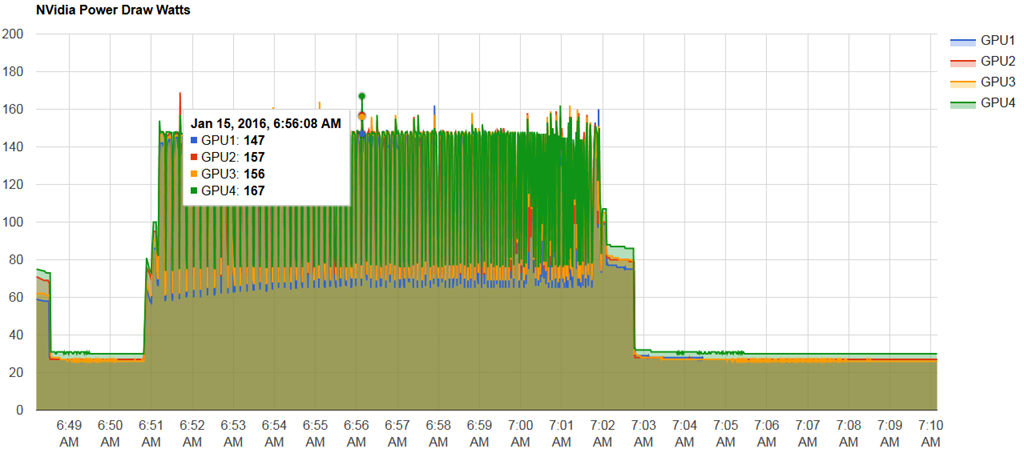
| GPU CPU Utilisation | GPU Memory Utilisation | GPU Temperature |
 |  |  |
| GPU Electrical Watts Used | GPU MHz | |
 |  | |
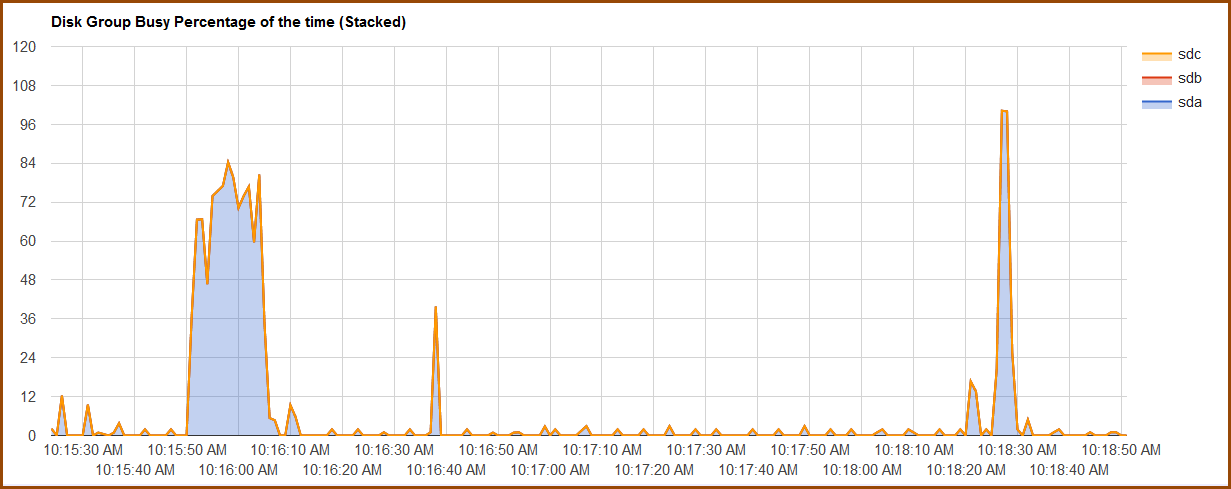
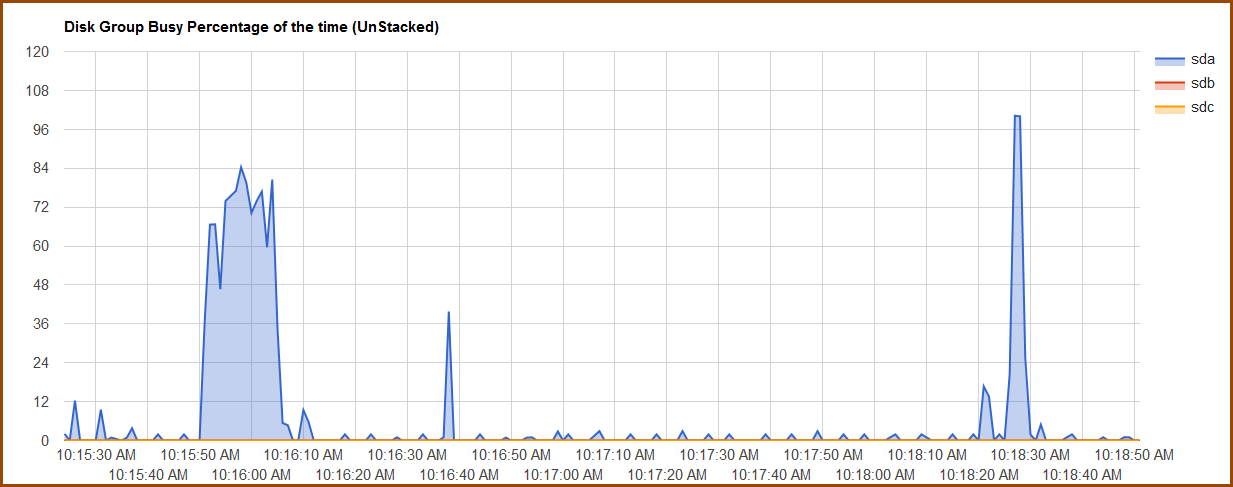
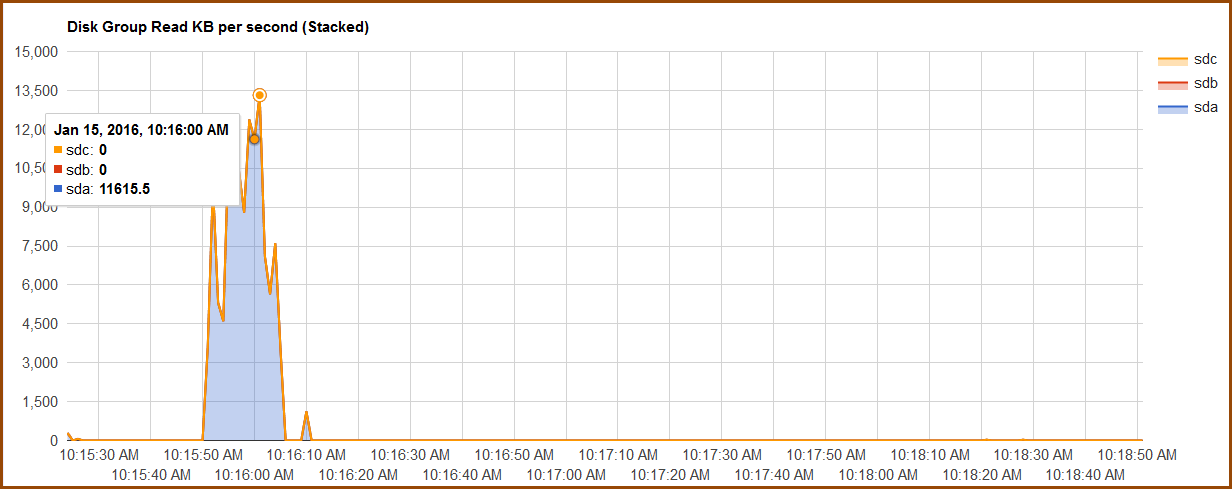
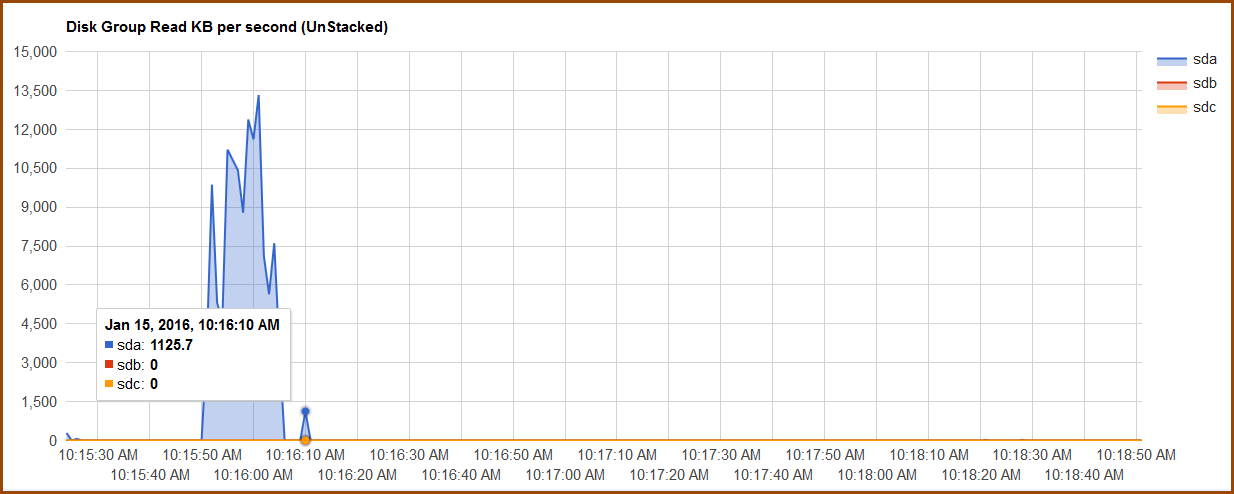
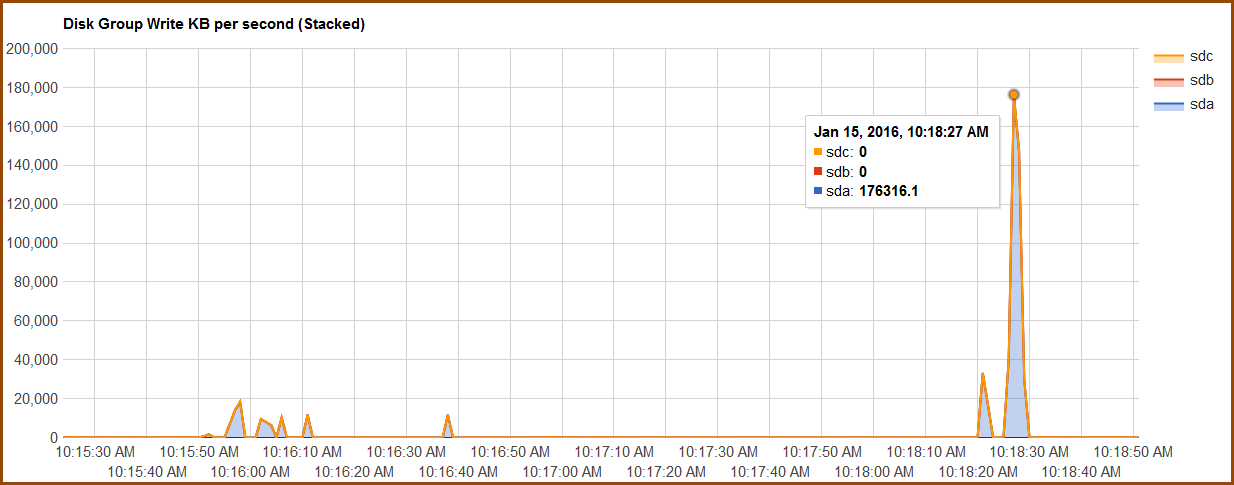
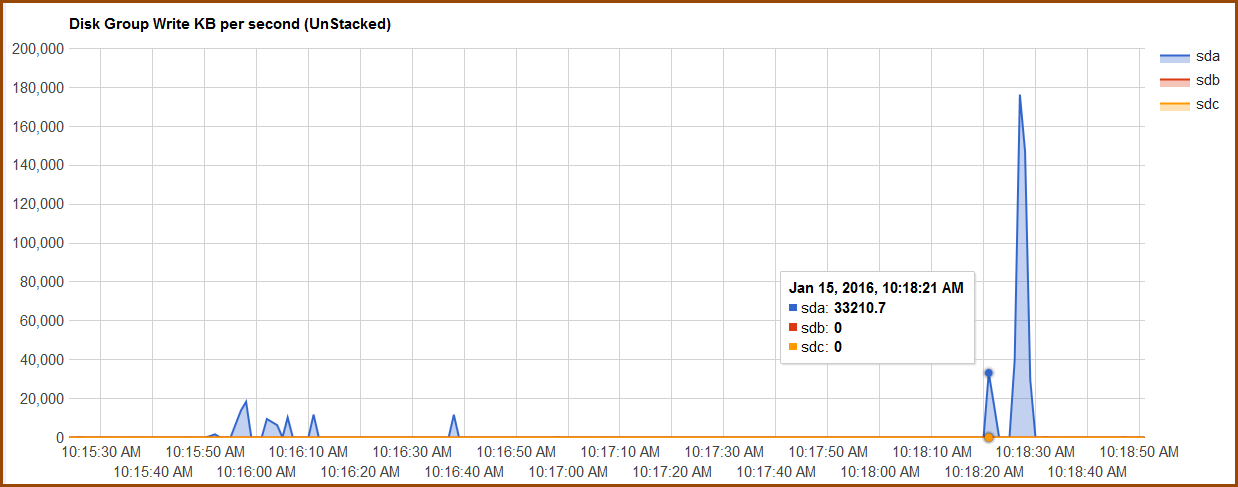
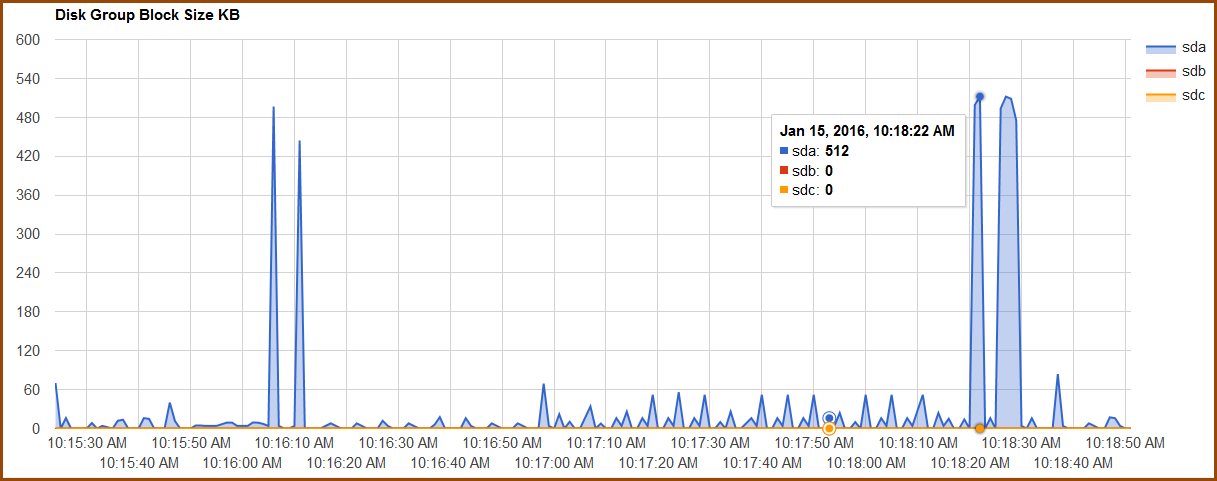
| nmon Disk Group Graphs | Captured on nmon for Linux with nmon -f -g auto So its only disks and the disk partitions are skipped | DG busy, DG read, DG write, DG block size & DG Xfers |
 |  |  |
 |  |  |
 | 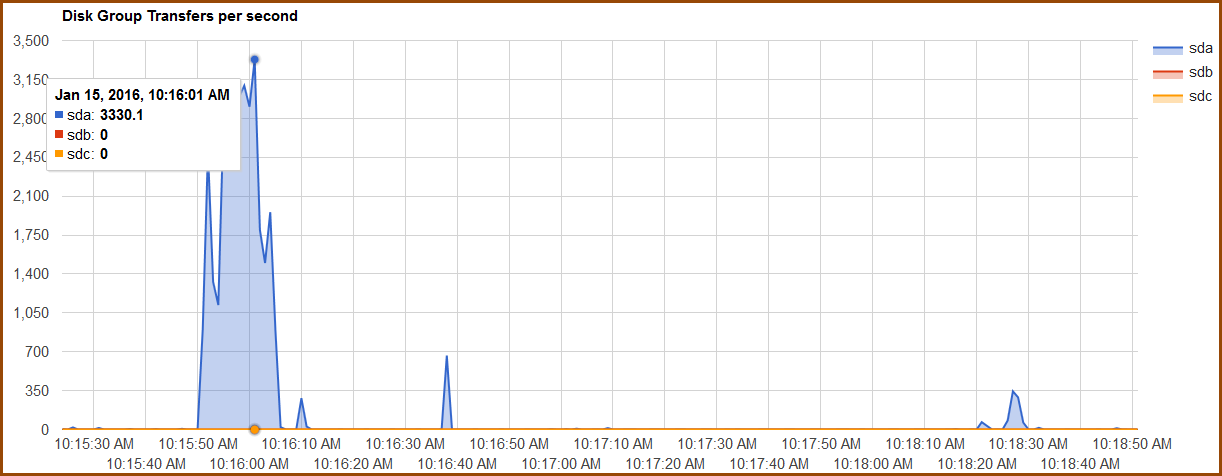 | |
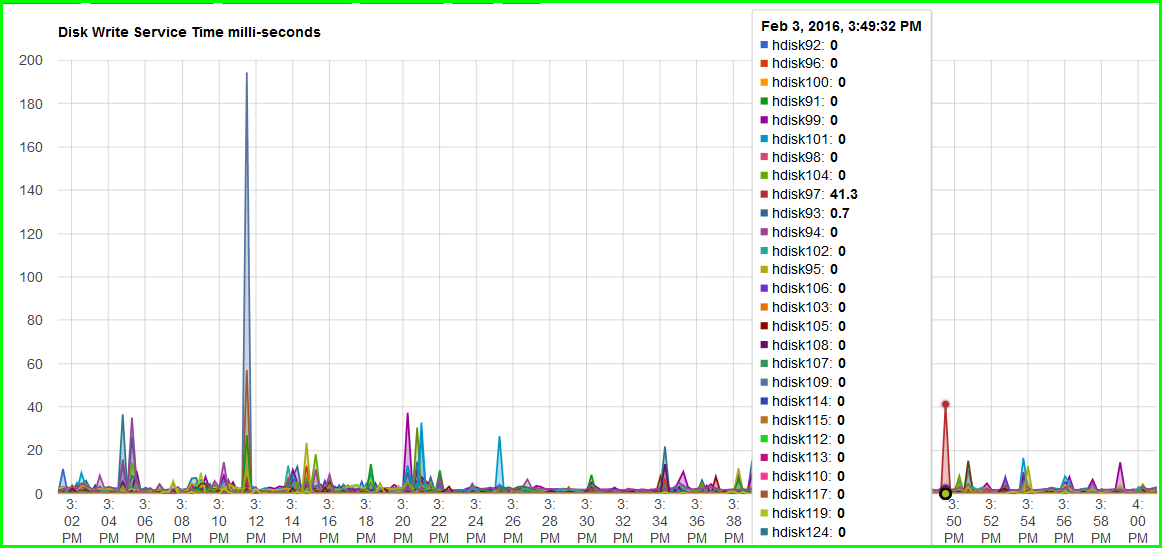
| nmon Disk Service & Wait Time | Captured on nmon for AIX with nmon -f -d | Disk Service Time, Disk Wait Time, Service Read Time & Service Write Time |
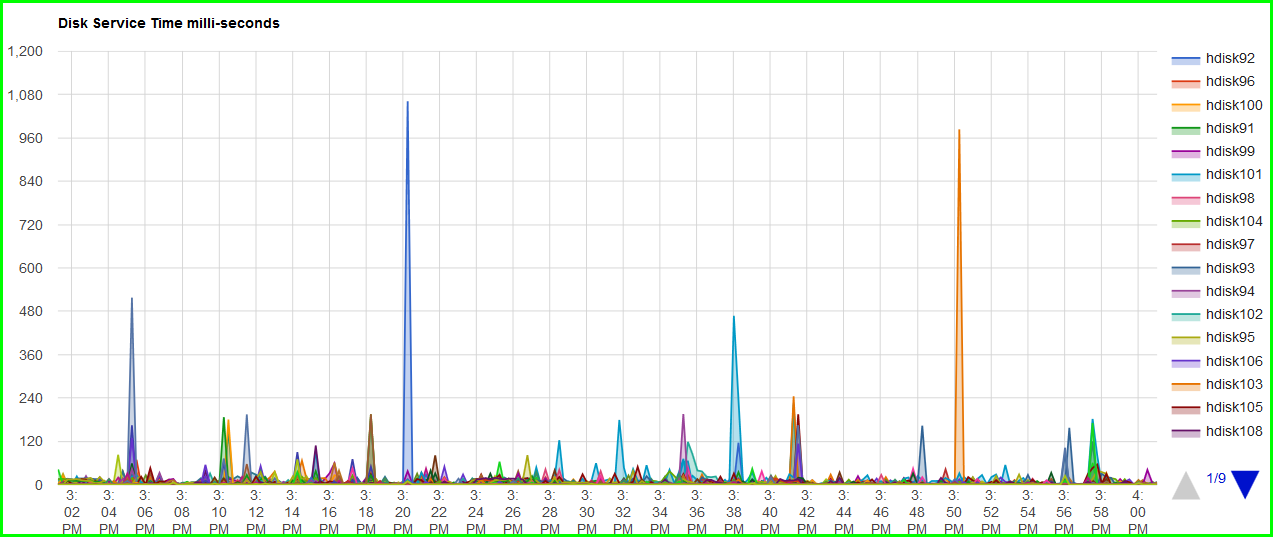 | 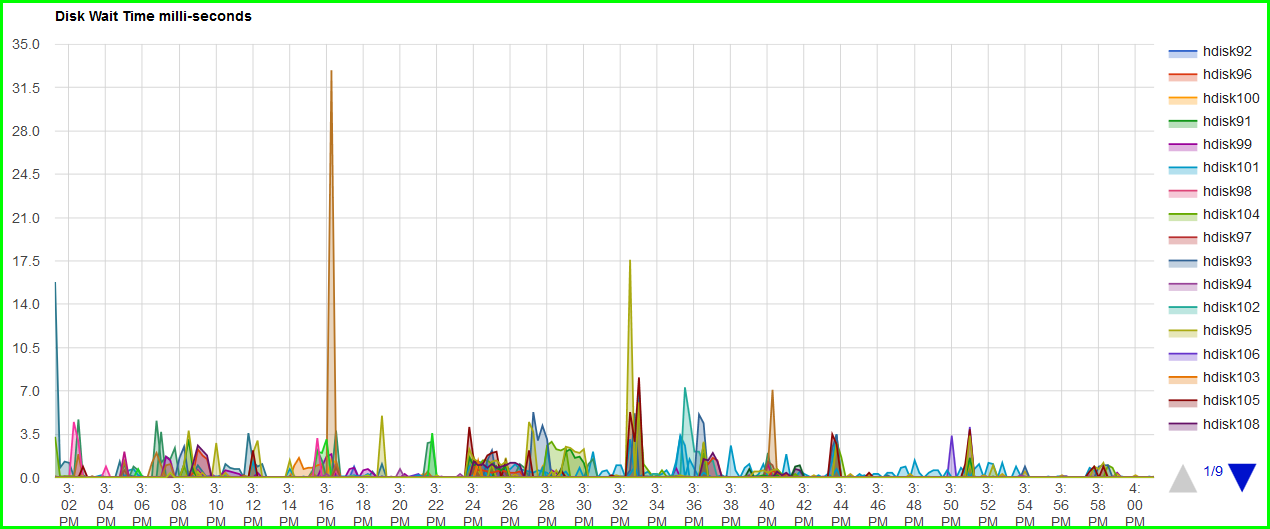 | |
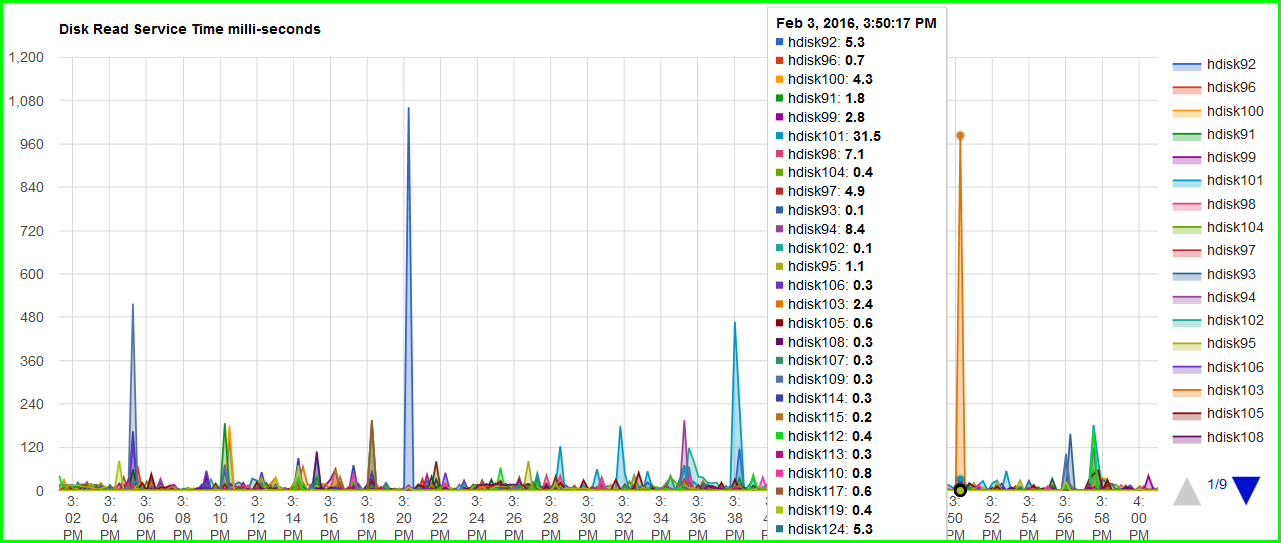 |  | |
| Version 27 new buttons AIX | New buttons Linux | Configuration Details pop-up |
 |  |  |
Versions32 - Mem Use graph 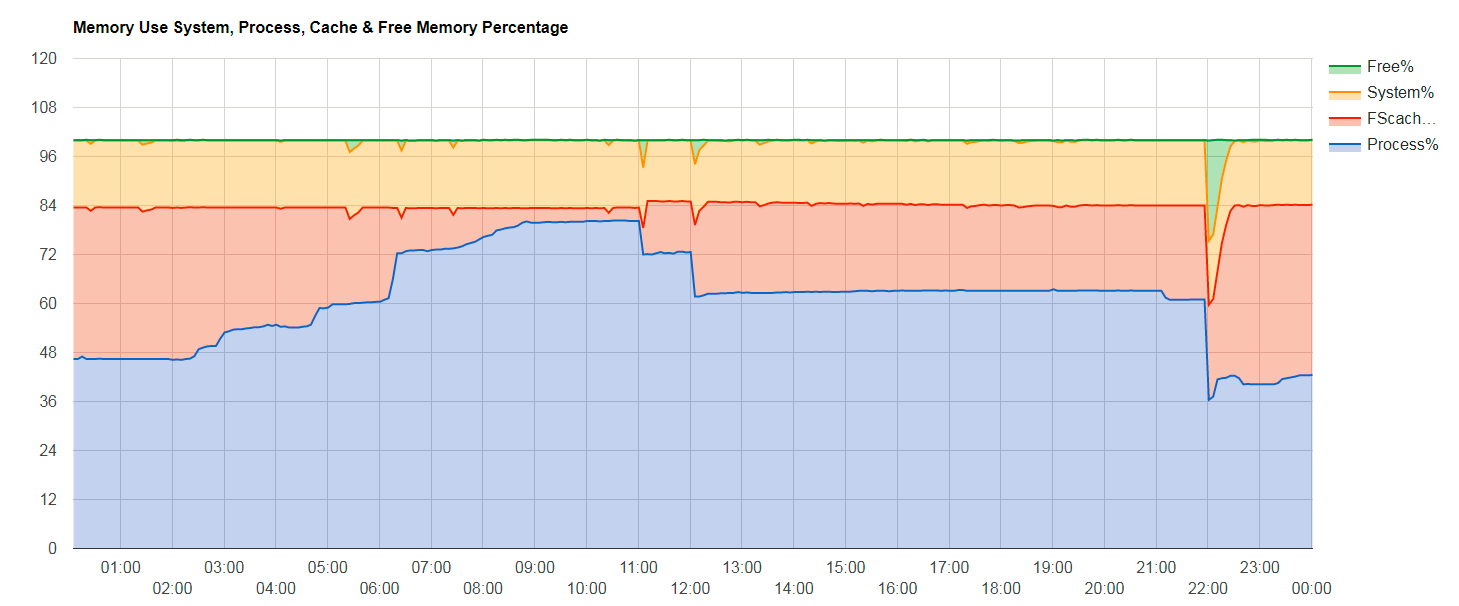 | Versions33 - Top Disk graph 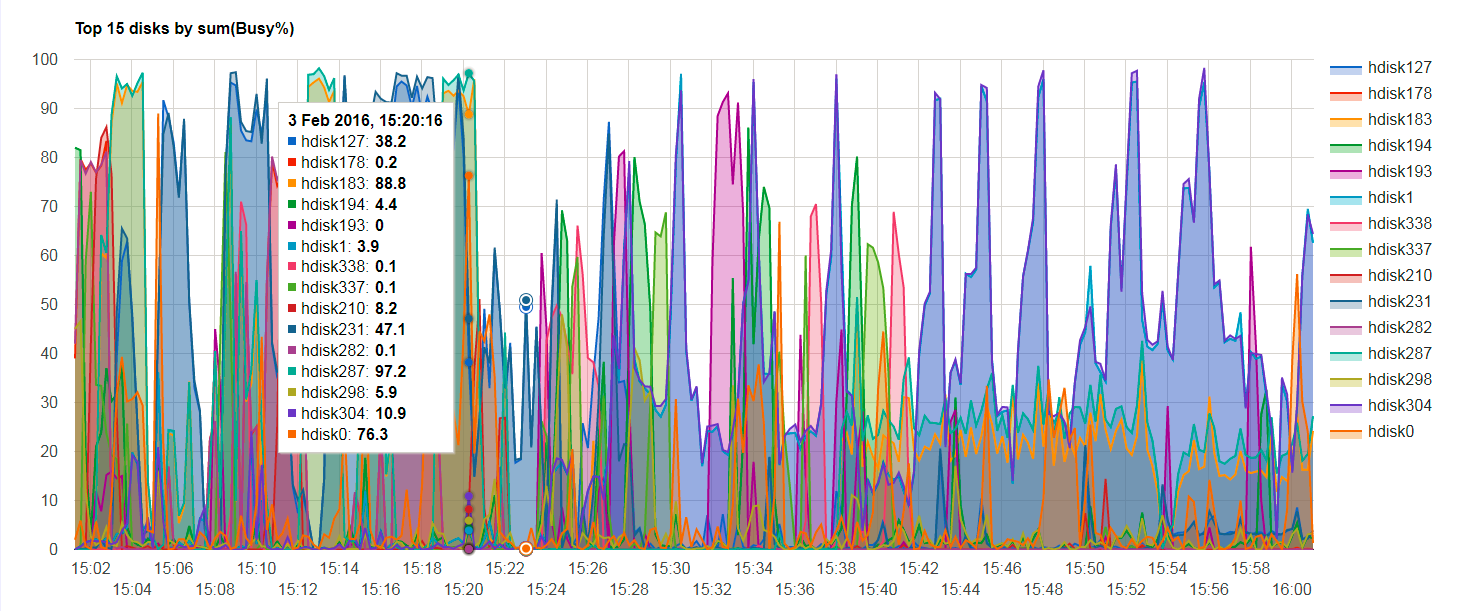 | Version 42 - AIX Volume Group  |
README for nmonchart 44 by Nigel Griffiths
The Korn shell script file nmonchart transforms .nmon performance capture files into .html files for a web server site.
If your .nmon is called hostname_date_time.nmon and the website pages are at /webpages/docs then use it like this:
./nmonchart hostname_date_time.nmon /webpages/docs/hostname_date_time.html
Alternatively, script the second parameter and the output file name is the first parameter, but the .nmon is changed to .html
The nmonchart script needs the Korn shell installed (ksh). nmonchart has NOT been tested with sh, Csh or bash. These are not supported. AIX and Linux have a Korn Shell called ksh, If your Linux does not have ksh, you should install it.
The script works out if it is running on AIX or Linux and makes two changes based on that. For details, check the top of the script.
nmonchart is complex as it is 1600 lines long. Mostly due to supporting so many graphs with roughly 10 to 10 lines per graph.
nmonchart is a fairly simple Korn shell script that mostly uses grep and awk. Awk can get a little complex.
For performance data in the nmon file in a fixed column format like
    physical CPU, run queue and memory stats
    It is easy to distinguish the column names and data columns.
For data that is not fixed format, as it depends on the variable numbers of
    resources like disk, network, and CPUs, the code is more complex.
    It has to work with the number of resources and the names from the header
    line, and then process the number of columns from the data lines.
The graphs like TOPSUM and TOPCMD are quite tricky, and the database has to be calculate, list orders and select from other data.
For testing included in the package there is a supplied sample nmon files
    The nmon file sampleC.nmon and a sample nmonchart output file called: sampleC.html

    The .html file was create like this:
       ./nmonchart sampleC.nmon
The same goes for sampleD.nmon
Examine the sampleC.html to find out how it contains the data and how it
    it generates the graphs inside your web browser:
  It is coded in JavaScript
  Which calls the Googlechart library (directly from the web) to generate
    the graphs
     - Find more information here https://developers.google.com/chart/
     - It has lots of functions and makes beautiful graphs
  For each graph
    - The data in JavaScript array format and the ZZZ data were transformed into
       a JavaScript date format
    - There are also chart drawing options and graph type instructions
  At the bottom of the script, it creates the JavaScript buttons.
  Then the config data is displayed at the bottom of the webpage.
Output file size
Note nmonchart output files (.html) are typically much smaller than the
    original nmon file.  Something like 20% of the size.
    Large .nmon files will take longer to process & display, but should finish.
This is unlike the nmon Analyser Excel files output, which can typically
be twice the size of the original .nmon file.
New Features from nmonchart version 44 - Feb 2026
 - Linux nmon files: Removed "Q" characters from the bottom Linux Version field.
 - AIX sed command does not support "\r" escape sequence so reverted back to the
   previously used "^M" to remove Carriage Return characters.
 - Thanks to Jozef Riha for reporting this issue.
New Features from nmonchart version 43 - Feb 2025
 - Using env command starts ksh using the shell $PATH instead of a hard-coded path.
   This allows macOS support.
 - LARGE nmon files = meaning more than 9999 snapshots in a file.
   Big thanks to **Ivor Goncharov** for these code fixes and advanced awk options.
   Change to awk that deals with Timestamps to use RSTART & RLENGTH, which allows
   Timestamps more than T9999 i.e. four digits.
 - Note: use "nmon -w digits" option (now also available in nmon for Linux 16r onwards)
   to set the number of digits in the Timestamp (T numbers used in ZZZZ lines).
   Suggest: -w 6 for up to 999999 snapshots.
   This stops ordering problems on T9999 to T10000 boundaries & T99999 to T100000 etc.
 - Graphs of 10,000 datapoints with a screen of 1920 pixels wide is "challenging"!
   But does work now, thanks to Ivor - the screen updates can take a few seconds.
 - Clean up one large sed command for readability and small corrections.
New Features from nmonchart version 42 - Small bug fixed for handling unusual data. - AIX Volume Group stats are graphed: VG Busy%, VG read & write KB/s,
VG Block Size and VG Transfers/s. The buttons are grey.
New Features from nmonchart version 40 - Support for VIOS SEA, VIOS SEA Packet and VIOS SEA Physical Network - This requires capturing with the nmon -O option on the VIOS - These and FibreChannel (FC) stats buttons go on a new line
- if found in the .nmon file.
- Change the threshold from 5.0 to 0.05 on CPU_USE graphs.
New Features from nmonchart version 39 - Support for AIX 7.2 TL4+ CPUMHZ state if you add the -y dfreq=on flag
on POWER9+
New Features from nmonchart version 38 - Added Disk Transfer Stacked graph - Changes Zoom in/out wording
New Features from nmonchart version 37 - Correction to the Paging rate graph title to
   "All Paging (pgin & pgout) & Paging from Paging Space only (pgsin & pgsout)
     per second"
   - Thanks to Alan Wilcox for reporting this confusion
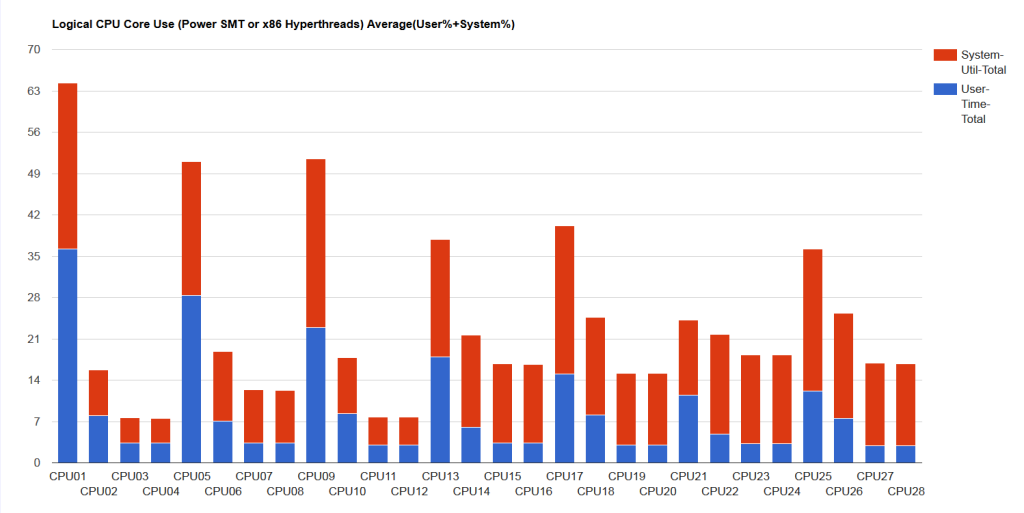
- Change Logical CPU USE (SMT) to ignore values below 5%
   - The highlight real use of the SMT threads + new title
   - Ignores SMT just ticking over
   - change graph title to explain this
    Average Use of Logical CPU Core Threads - POWER=SMT or x86=Hyperthreads
    (ignoring values below 5%)
- Typo transfers to transfers
New Features from nmonchart version 35 - thanks to Klaus Franke for the
speed up code snippet
- Good speed up in performance - specially with large numbers of
snapshots (i.e. many thousands)
- Added four AIX Fibre Channel Graphs by request. Note you need to run
    nmon with the -^ to include FC stats.
  FC READ & WRITE KB/s and FC TRANSFERS IN and OUT/s
- Removed the need for the 2nd parameter - it uses the 1st parameter &
    will replace the .nmon with .html
  If not ending in .nmon it just added the .html anyway.
New Features from nmonchart version 34 - thanks to Enrico Joedecke for
the fix and suggestions
- Fix to TopDisks by adding the paste command -d, option - Added to Linux nmon files from PowerVM (POWER hypervisor) Physical CPU
and Shared CPU Pool Free graphs
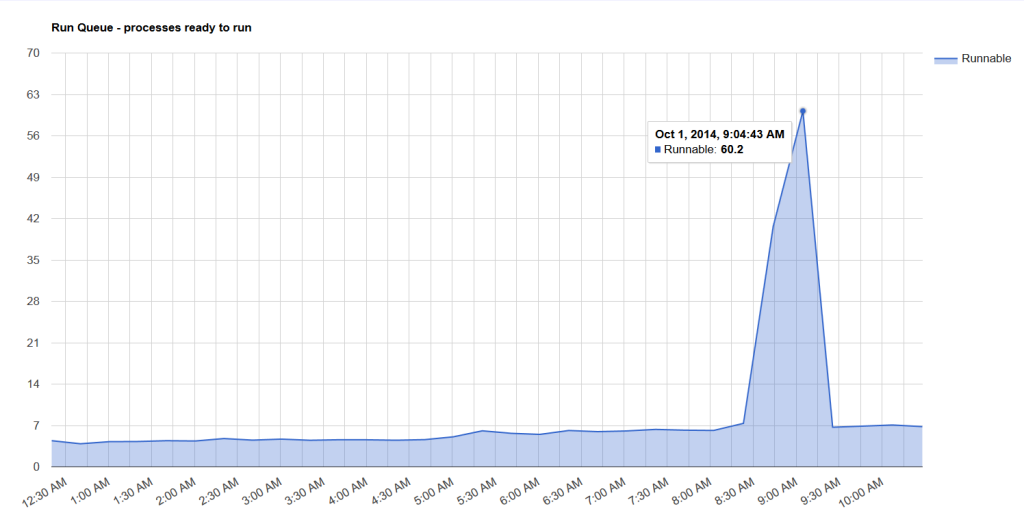
- For Linux the RunQueue graph includes Blocked processes - JFS data "nan" short for "not a number" (usually not a real filesystem)
replaced with -1.234 so graphs work
New Features from nmonchart version 33 - Added the Top 15 Disks graph - button on the top line - Top disks are determined by the sum of all the Busy percentages for each disk - Short-lived peaks to high percentages may not appear as a busy disk - The top 15 disks can help when the nmon file has many tens to hundreds
or thousands of disks.
New Features from nmonchart version 32 - Added the AIX MemUse graph for Process%, File system cache%, System%, Free% - Added handling of Linux GPU, if there is just one GPU
New Features from nmonchart version 31 - Fix for Top Processes sort arguments for Linux, which handles -t, differently - Fix Linux machines with no disks reported in AAA,disks,0 line
- we skip graphing the disks
- Added sampleD.nmon and sampleD.html as a much larger & more interesting
set of nmon stats
- Note: sampleC had some stats faked up my me!
New Features from nmonchart version 30 - work around differences of echo and print for AIX and Linux - see PRINTN
in the script.
New Features from nmonchart version 29 Zoom In and Out added - thanks to Ivan Goncharov for the hint - Left-click and drag the mouse to highlight an area to Zoom, then when
you let go, it will Zoom In
- Right-click to Reset and see the whole graph again
New Features from nmonchart version 28 1) Added PROCCOUNT (count of processes) as this was released via an
AIXpert Blog about nmon External Data Collectors
2) Added MORE1 and MORE3 examples for people adding their own stats. 3) Buttons for adapter typo fixed
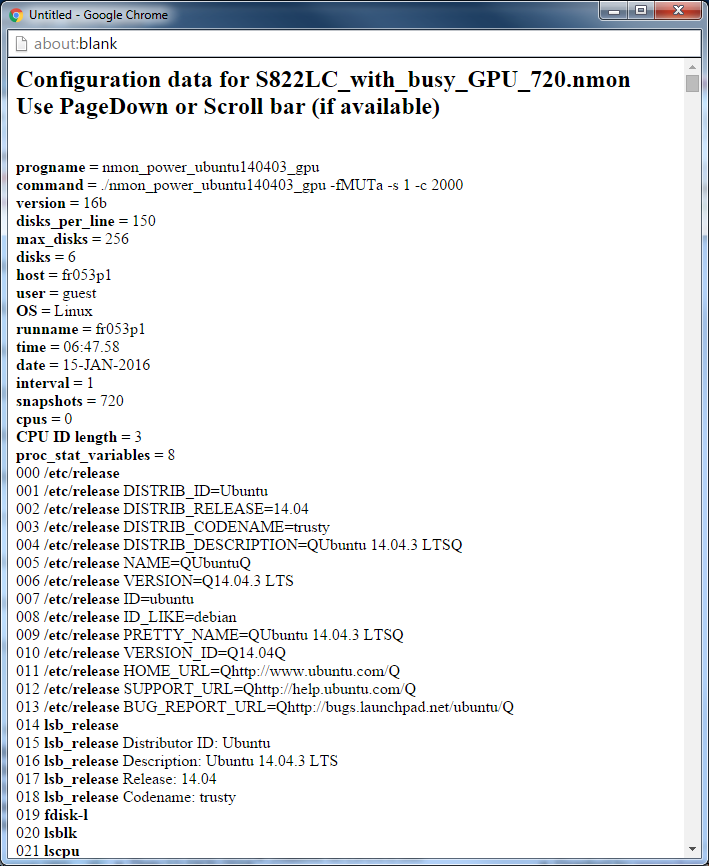
New Features from nmonchart version 27 The buttons' labels are upper and lowercase = look nicer Added the nmon Configuration button to pop a window with the AAA & BBB data Unfortunately, this highlights the browser behaving differently - Firefox has no scroll bars, so use PageDown - Chrome has scroll bars - Internet Explorer, I get a blank windows but it works for other people The Top Process Summary and Top Commands Buttons moved up at the top
line to save space
If you do not want the Config button (it does add to the .html size)
set wantCONFIG=0 near the top of the nmonchart script - =1 means we want it.
New Features from nmonchart version 27 1) Better Configuration button support 2) Top Commands bubble diagram and graph move to the top line 3) Graph title improvements and clarification 4) Buttons in mixed case for readability 5) Link to nmonchart download and information website
New Features from nmonchart version 26 - not released
New Features from nmonchart version 25 Added the following AIX Disk Service time stats, which are collected
if you add the nmon -d option
In the nmon file, these lines start with
DISKSERV DISKREADSERV DISKWRITESERV DISKWAIT
- Disk Service time in milliseconds - Disk Read Service time in milliseconds - Disk Write Service time in milliseconds - Disk Wait time in milliseconds
New Features from nmonchart version 24 1) Disk Groups Now supports User Defined Disks Groups data. nmon -g filename
or nmon -g auto
- This is particularly good for nmon for Linux i.e. -g auto will remove
all the disk + partition duplication
- In the data file, look for likes starting with DGBUSY, etc. - Also very good to group your disks like database, backup, dump,
or RDBMS_log, RDBMS_data
- New Graphs
    DGBUSY - Disk Group busy percentage for each disk - Stacked lines
    DGBUSYu - Disk Group busy percentage for each disk - Unstacked lines
    DGREAD - Disk Group read throughput in KBytes per second for each disk
    - Stacked lines
    DGREADu - Disk Group read throughput in KBytes per second for each disk
    - Unstacked lines
    DGWRITE - Disk Group write throughput in KBytes per second for each disk
    - Stacked lines
    DGWRITEu - Disk Group write throughput in KBytes per second for each disk
    - Unstacked lines
    DGSIZE - Disk Group block sizes
    DGXTER - Disk Group Transfers per second
2) S822LC can have NVidia GPU adapters - A special nmon version 16c to capture, GPU stats: GPU Util, Memory Util,
Temperature, Watts and GPU MHz
- In the data, look for lines starting with GPU_ - Note that each adapter has two GPUs so a total of four - New Graphs
    GPU_UTIL - NVidea GPU Stats, GPU CPU Utilisation percent
    GPU_MEM - NVidea GPU Stats, GPU Memory Utilisation percent
    GPU_TEMP - NVidea GPU Stats, Temperature in degrees Centigrade
    GPU_WATTS - NVidea GPU Stats, input electrical power in Watts
    GPU_MHZ - NVidea GPU Stats, GPU Mhz
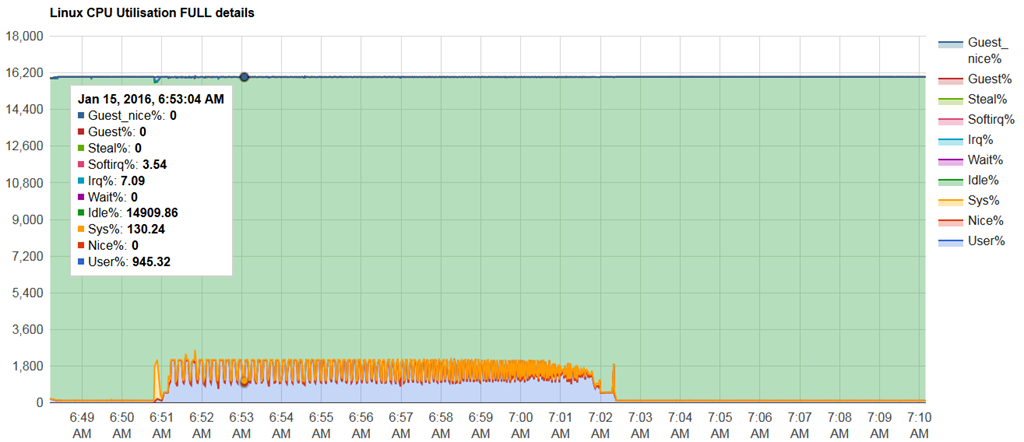
3) Linux Utilisation stats now ten of them - Linux now has ten utilisation stats: user, nice, system, ide, wait for IO,
steal, irq, soft irq, guest and guest nice
- nmon for Linux 16c onwards captures these - Note that a CPU core thread is reported as 100% otherwise, machines with
160 only ever reports tiny percentages.
- New Graph
    CPUUTIL_ALL
    Not included the data for each CPU core thread
    - My workstation machine have up to 160!!!
Summary of the graphs
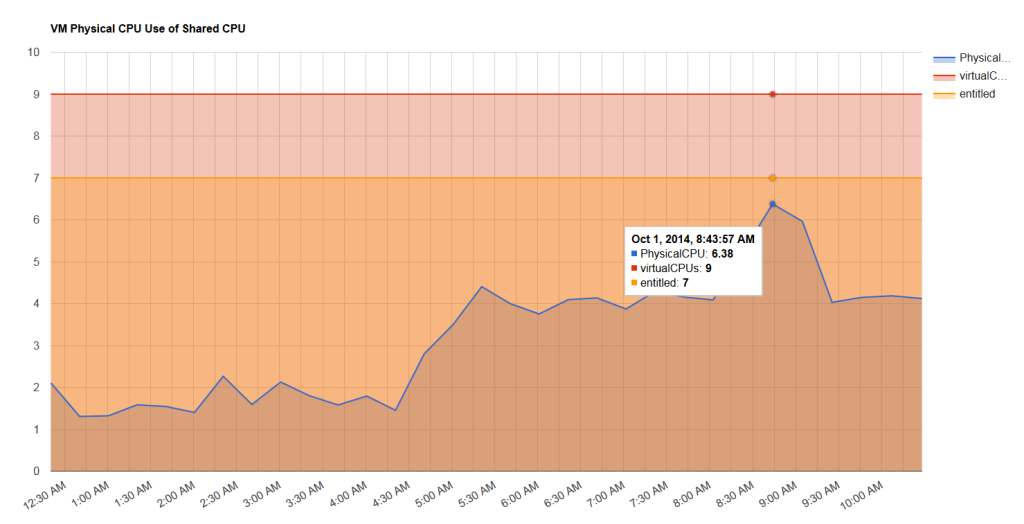
PHYSICAL_CPU - PhysicalCPU, VirtualCPU & entitlement (AIX only LPAR stats))
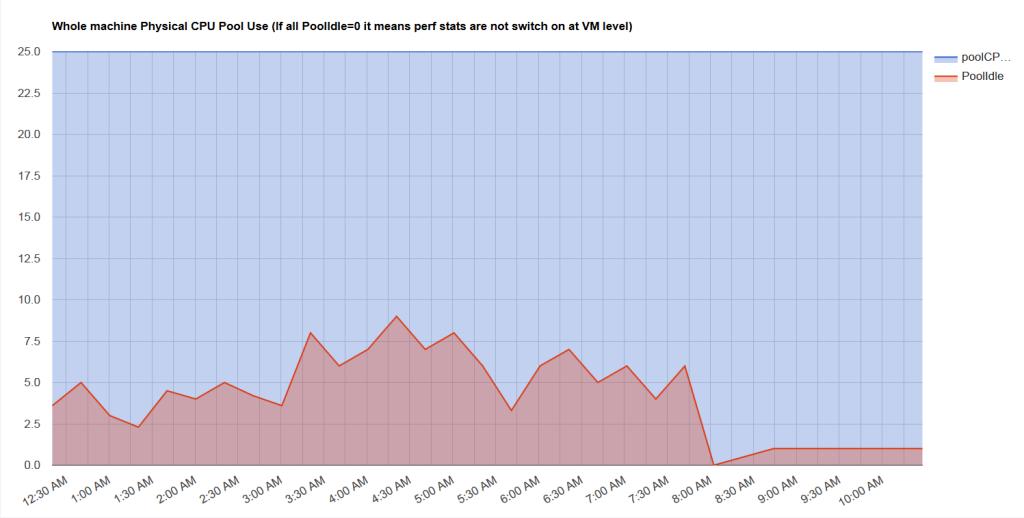
POOLIDLE - If switched on at the LPAR level PoolIdle & Pool CPU count
(AIX only
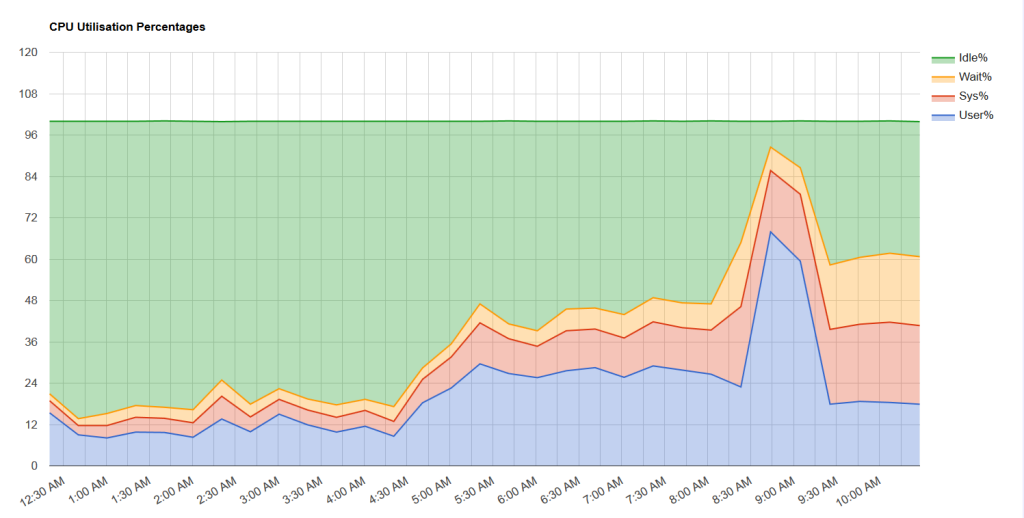
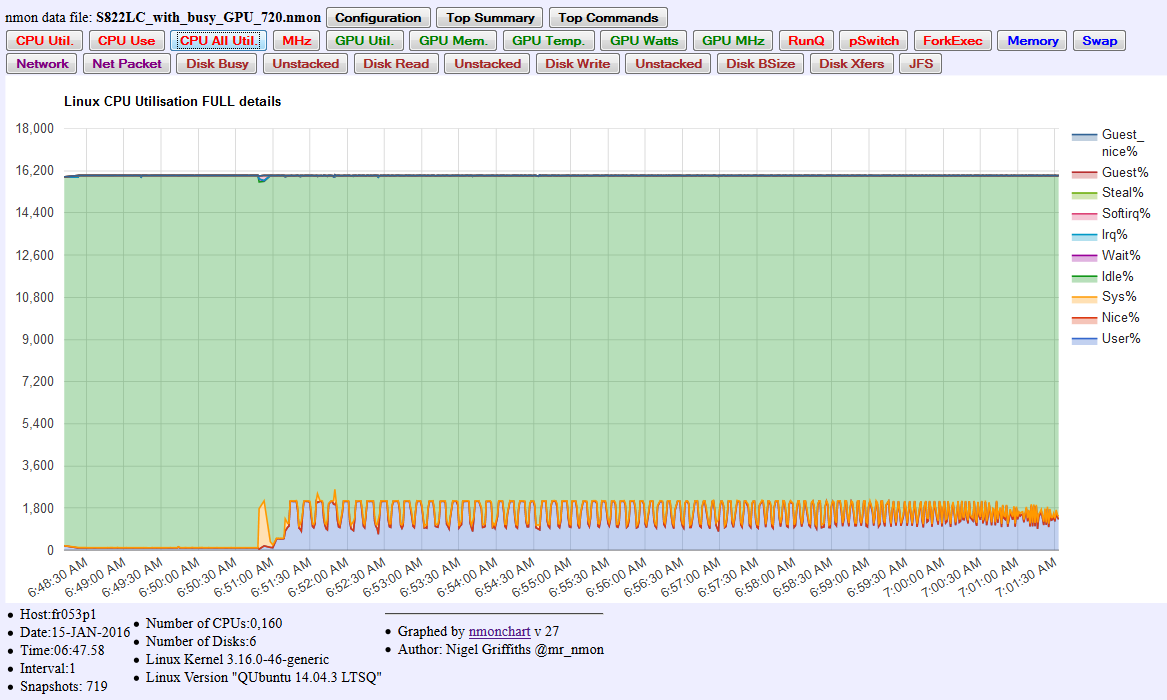
CPU_UTILisation - User%, System%, Wait% and Idle%
CPU_USE - Logical CPU Core Use (Power SMT or x86 Hyperthreads)
Average(User%+System%)
RUNQ - Run Queue in number of processes
PSWITCH - Process Switches as the kernel runs different programs
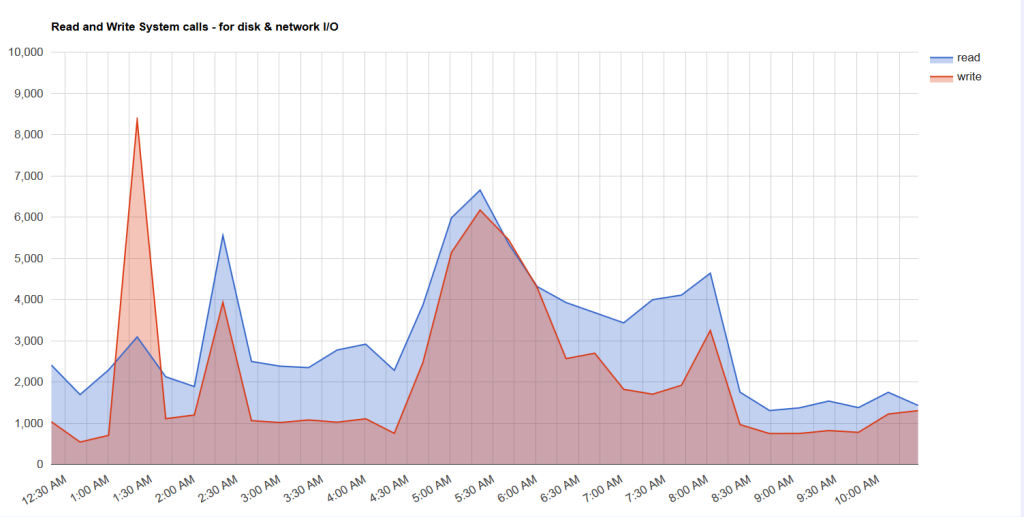
SYSCALL - System calls of processes requesting Kernel operations
- Total and read, write calls
READWRITE - Read and Write System calls only
FORKEXEC - Systems call fork (duplicate a process) and exec
(overwrite current process with a new program)
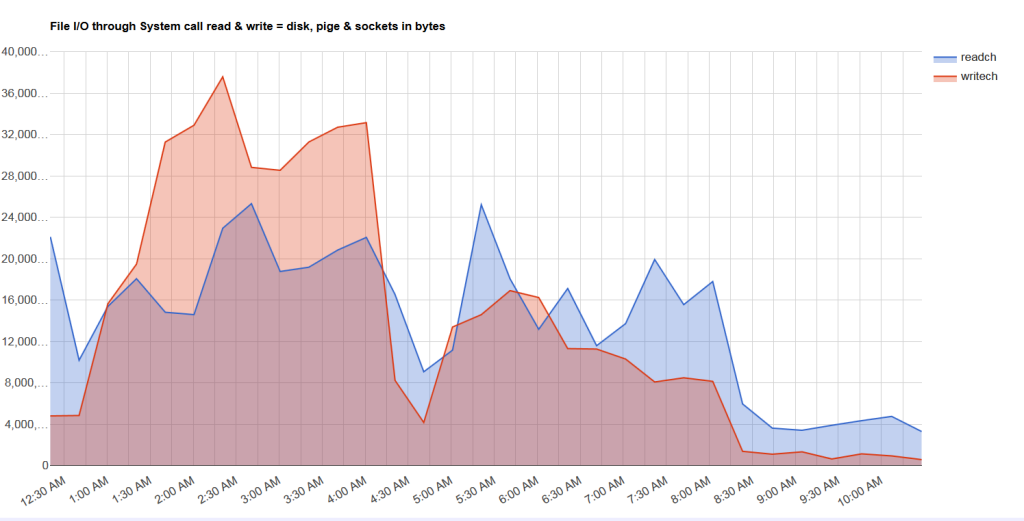
FILEIO - System call - number of bytes on the read + write system call
- includes disks, network sockets and pipes
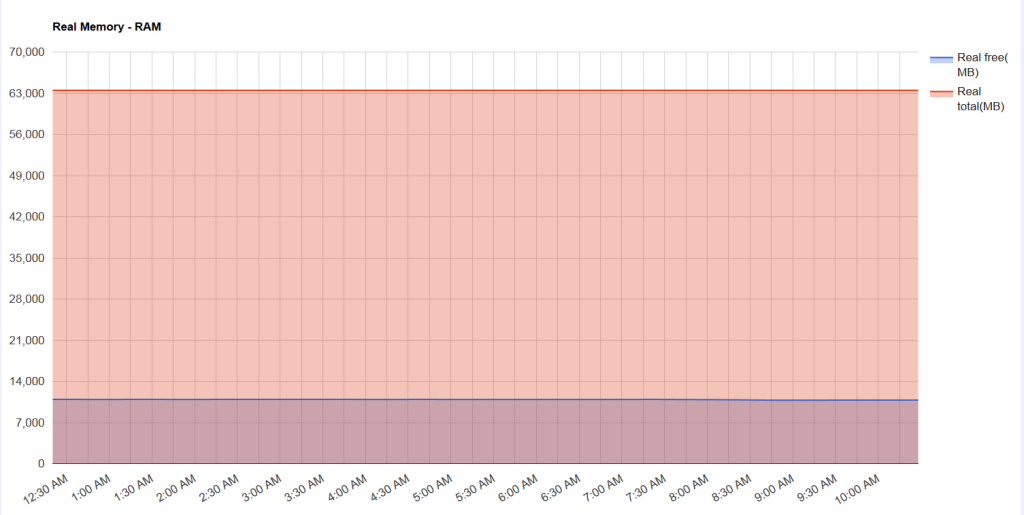
REALMEM - Total RAM (MB) and Free RAM (MB) (AIX only)
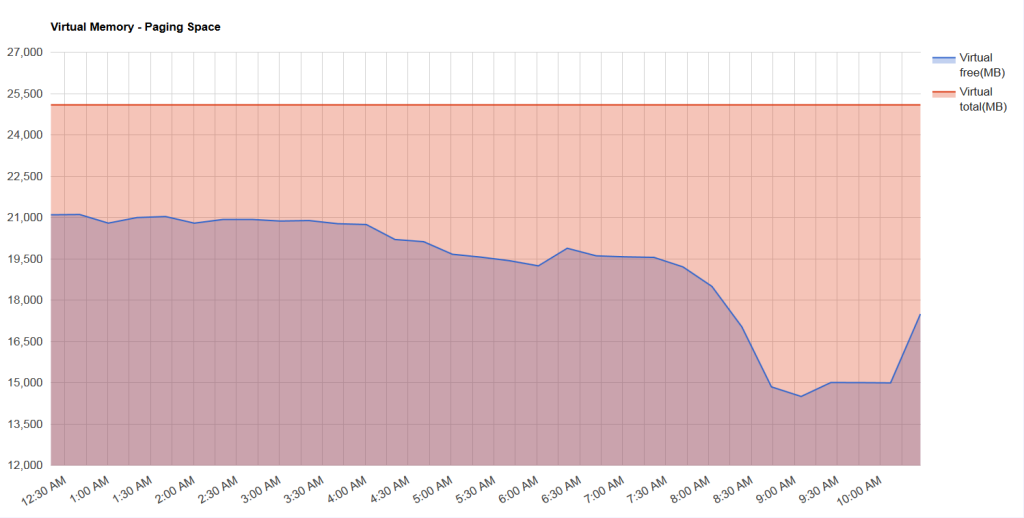
VIRTMEM - Virtual memory (paging space) Total (MB) and Free (MB) (AIX only)
MEM_LINUX - Total RAM, Free RAM (MB), and other Linux memory stats
(Linux Only)
SWAP_LINUX - Swap size (MB) and Swap Free (MB (Linux only)
FSCACHE - Filesystem Cache (numperm) size in percent with minperm%
and maxperm% (AIX only)
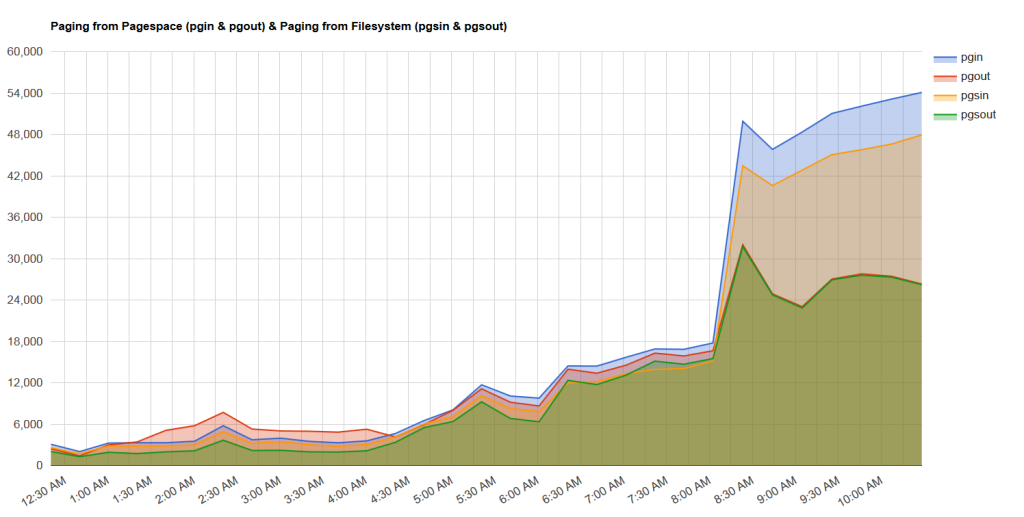
PAGING - Paging space: pages in (pgin) and out (pgout) plus Filesystem
paging: in (pgsin) and out (psout)
SWAPIN - Process swap back into memory per second
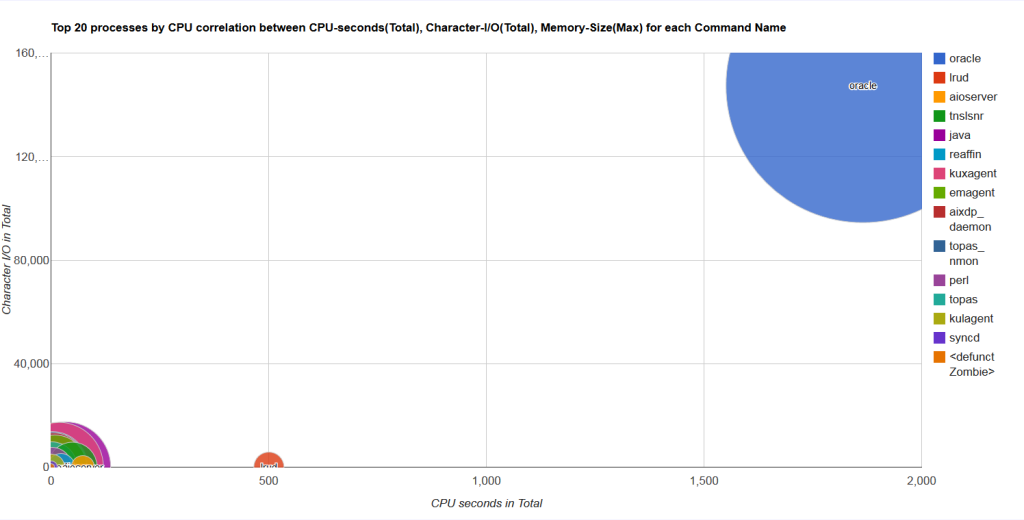
TOPSUM - If your nmon file includes the TOP process (nmon -t or nmon -T)
- Bubble diagram of top process by total CPU cycles, total I/O KB
and max Memory size
- Horizontal axis = CPU cycles in total
- Vertical axis the I/O generated, this could be network, disk,
pipes, sockets
- The size of the bubble is the memory size
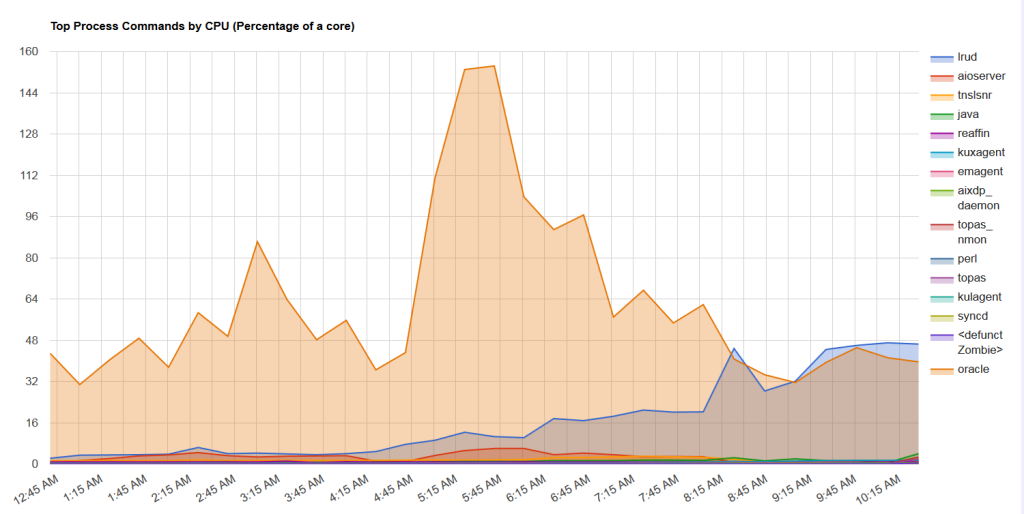
TOPCMD - If your nmon file includes TOP process (nmon -t or nmon -T)
- top 15 commands and their CPU use over time.
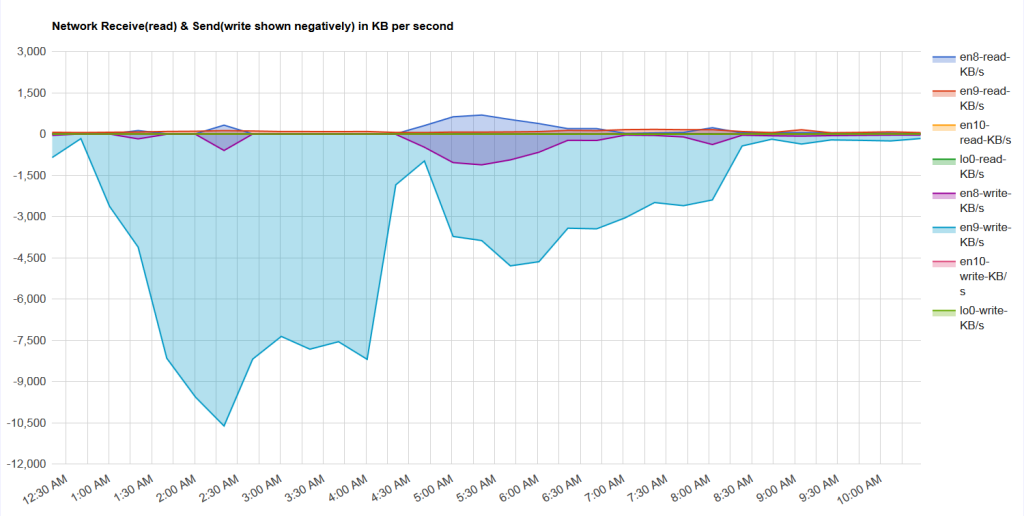
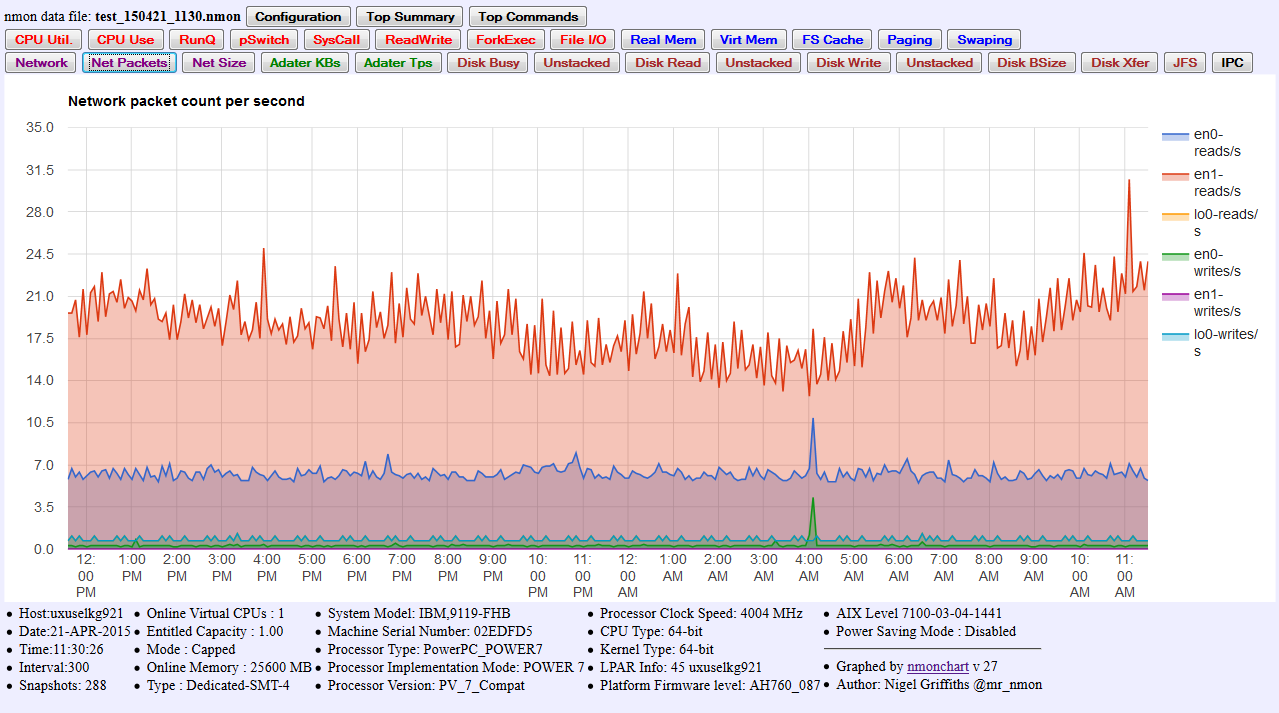
NET - Network throughput read & write for each network in KBytes per second
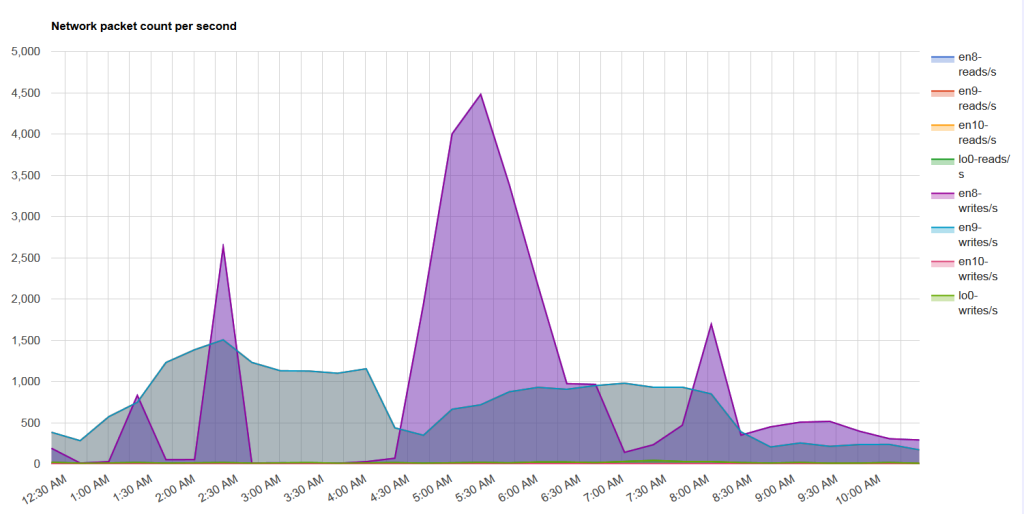
NETPACKET - Number of read & write packets per second for each network
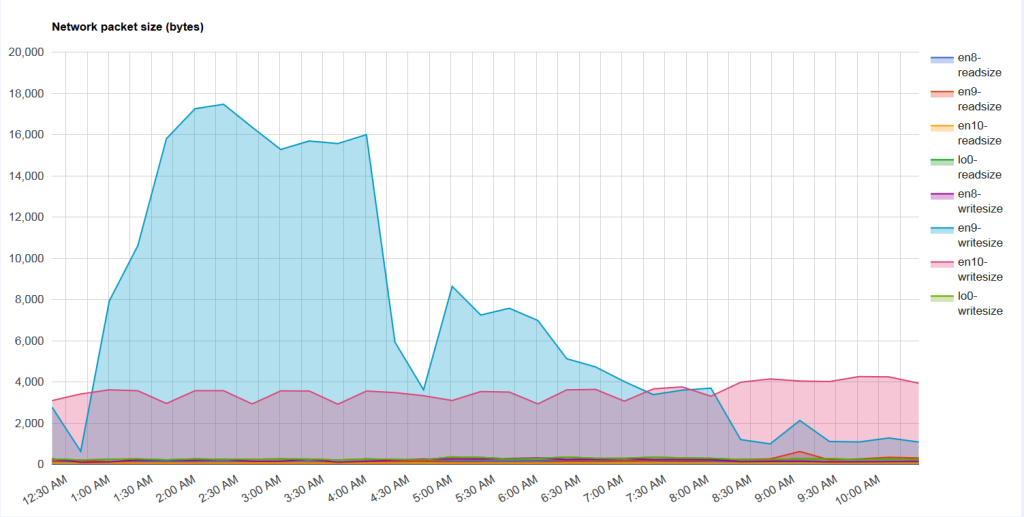
NETSIZE - The average number of bytes in each packet for each network
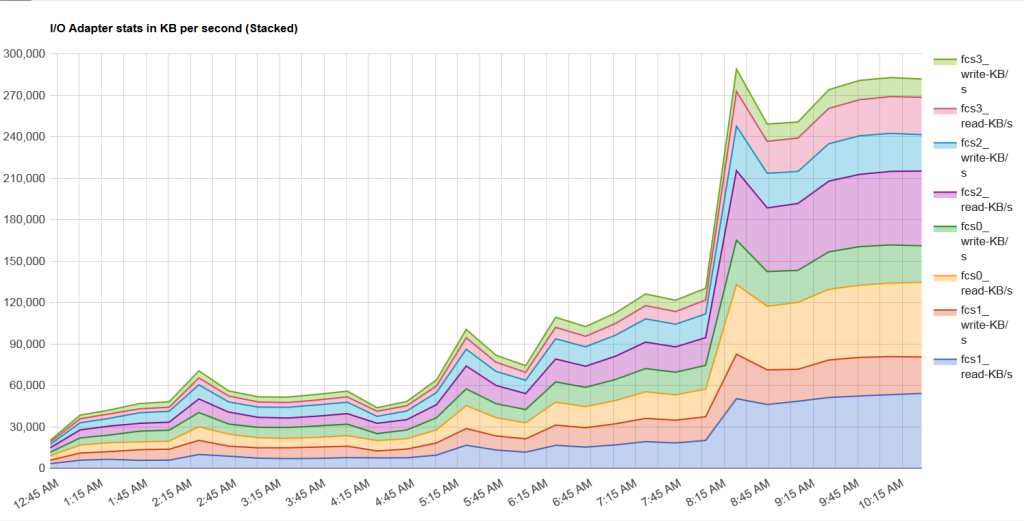
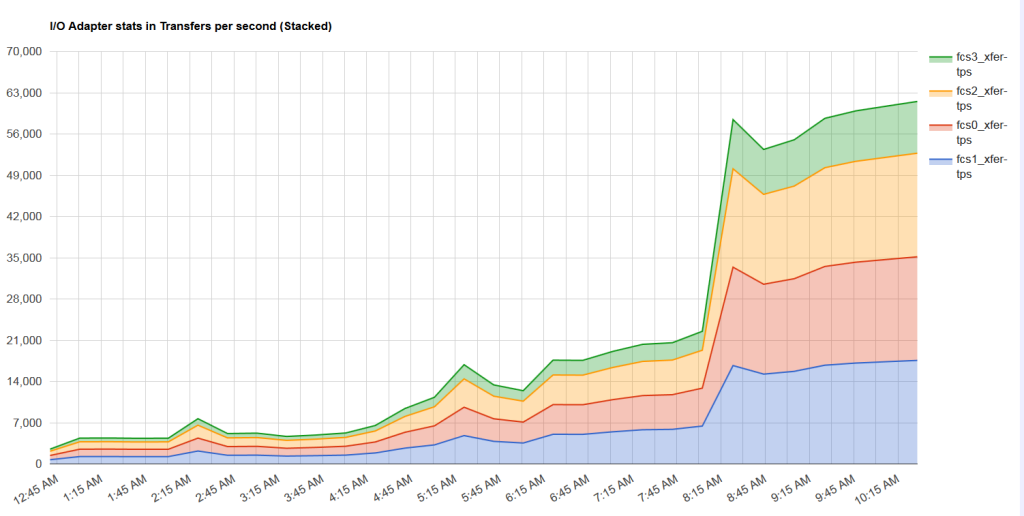
ADAPT_KPS - Throughput in KBytes per second read & write for each disk
adapter
ADAPT_TPS - Transactions per second read and write for each disk adapter
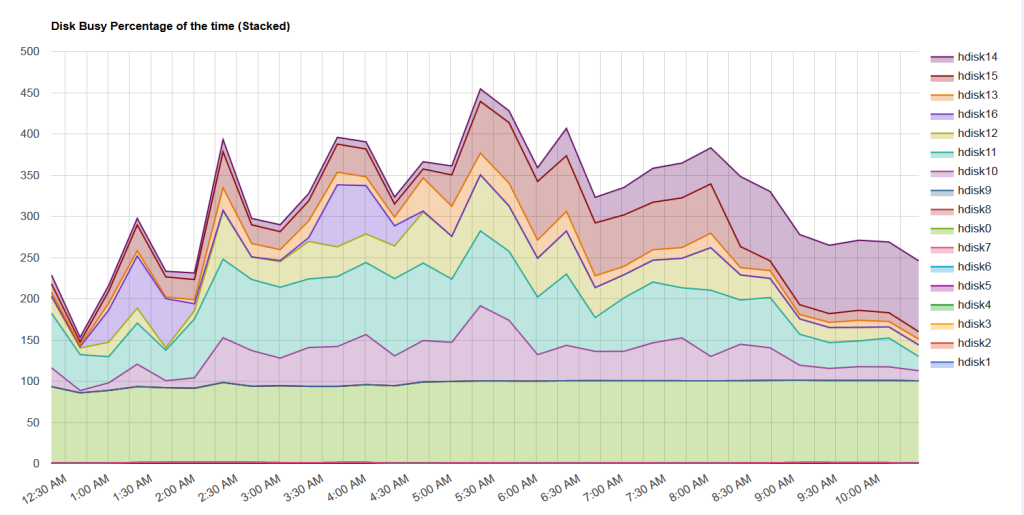
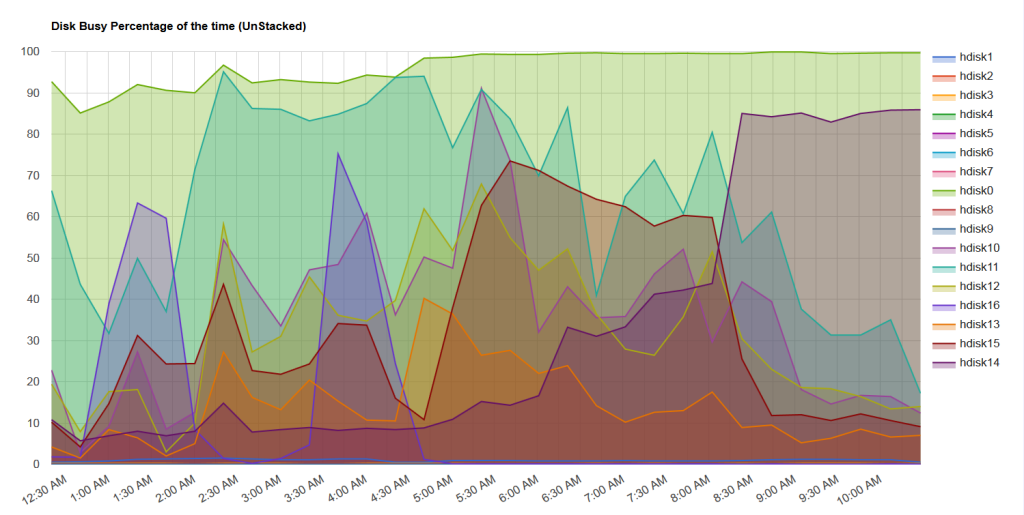
DISKBUSY - Disk busy percentage for each disk - Stacked lines
DISKBUSYu - Disk busy percentage for each disk - Unstacked lines
DISKREAD - Disk read throughput in KBytes per second for each disk
- Stacked lines
DISKREADu - Disk read throughput in KBytes per second for each disk
- Unstacked lines
DISKWRITE - Disk write throughput in KBytes per second for each disk
- Stacked lines
DISKWRITEu - Disk write throughput in KBytes per second for each disk
- Unstacked lines
DISKBSIZE - Disk block sizes
DISKXTER - Disk Transfers per second
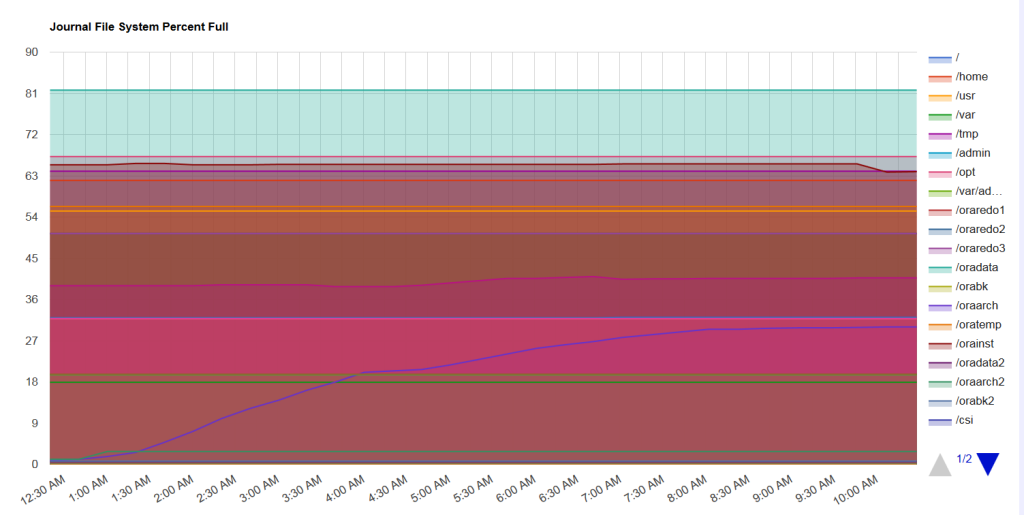
JFS - Journaled Filesystem Percent Full
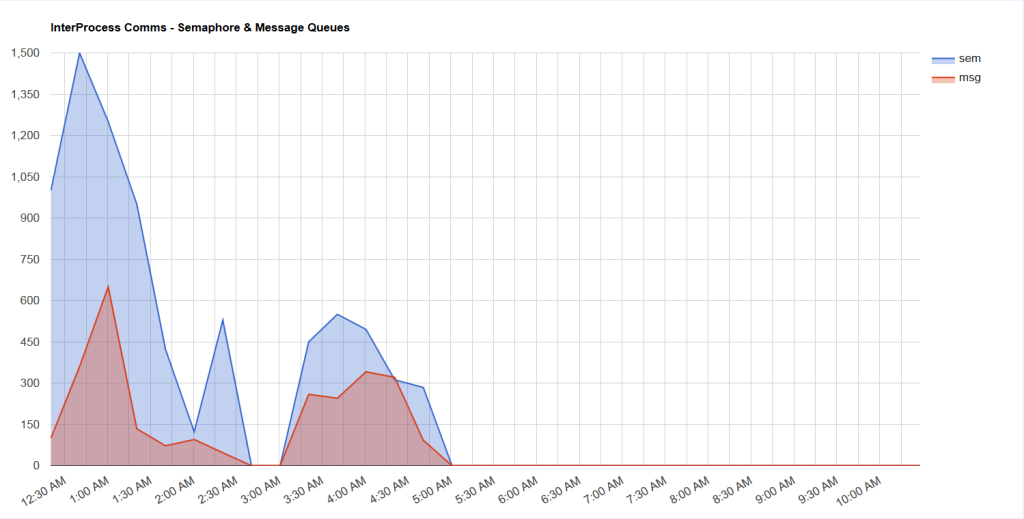
IPC - Inter-process Communication, meaning semaphores, shared memory segments
and message queues.
Graphs not supported
  More than 150 Disks - You have the adapter view for overall Disk stats.
    Data files with crazy numbers of disks in the thousands are just
    impossible or graph or manage (IMHO). Please rethink or disk strategy
    and get the storage subsystem to do the work and not you.

    The first 150 plus the top 20 plus the adapter totals is a good compromise.
Graphs that are not going to happen and why
	Individual Logical CPU Utilisation, also called CPU core threads
         - up to 1920 with the new Power10 E1080 with 140 cores)
        Mostly pointless and misleading - they are timesharing the
         physical CPU cores.
        Better to study the VM LPAR physical CPU use and UTIL graphs.
Adding new graphs - I am interested in hearing your ideas on new graphs you would like to have. - They need to add value for most nmon users - Adding graphs from the nmon file is pretty easy as we have
already worked through the issues of most formatting options
- So it is a cut'n'paste, rename the graph and make minor formatting changes
for the column, don't forget the button lines at the bottom.
- Yet more disk graphs for stupidly high numbers of disks is not a good idea.
nmonchart created webpages or Graph failures
If you transform the nmon data but the webpage does not work -
What should you do?
1 Feel free to send me the original nmon file to investigate 2 Mostly, the webpage will probably display OK but the buttons will not work 3 JavaScript and Google charts are rather fussy in the syntax 4 Sometimes the first few graphs work, but later in the page, ones will
    not do anything - this is a good indicator of where the syntax issue
    is in the file.
5 If something like the number of disks changes during the collection of
    data, then you will find the disk buttons and later buttons will not work.
    The nmon data collection does NOT handle this by design. This is to
    reduce nmon CPU time by a large amount.
    If you need this feature, move to njmon.
6 You could go looking at the .html file, looking for oddly formatted
lines - I have tried to indent the JavaScript code to make this possible.
7 If you work a fix, please email the original nmonchart and the fixed
nmonchart scripts, plus a sample nmon file that includes the data graphed.
Testing of nmonchart
I have more than 1000 nmon files to test. This includes:
  Current AIX 6 and 7
  Backdated AIX 6 and 7, including some with nmon errors from 5 years ago
  Old AIX 5 files - mostly to check utilisation before upgrading to POWER8

  Current Linux on Power from SUSE, Ubuntu and Red Hat
  Current Linux on x86 and x86_64 from SUSE, Ubuntu and Red Hat
  Also other hardware like ARM.
  Other Linux distros and some older releases, too.

  On strange, rare or older nmon files, a lot of work has gone into
	support or at least not crashing on oddly formatted data
- nmonchart is now pretty robust ... unless you know differently!!
  I would like more examples from Mainframe and other Linux distros.
  Also, examples of large servers running at 70 to 90% busy with
    more than 32 CPU cores and 1TB of memory
Upload and Generate Graphs Website on the Internet
Currently, this is supported an https://mr-nmon.com
You upload a single .nmon file and it returns the .html graph output.
Cheers Nigel Griffiths nigelargriffiths@hotmail.com